Slovene vs Immigrants from the Azores Unemployment Among Ages 60 to 64 years
COMPARE
Slovene
Immigrants from the Azores
Unemployment Among Ages 60 to 64 years
Unemployment Among Ages 60 to 64 years Comparison
Slovenes
Immigrants from the Azores
4.4%
UNEMPLOYMENT AMONG AGES 60 TO 64 YEARS
100.0/ 100
METRIC RATING
18th/ 347
METRIC RANK
4.0%
UNEMPLOYMENT AMONG AGES 60 TO 64 YEARS
100.0/ 100
METRIC RATING
5th/ 347
METRIC RANK
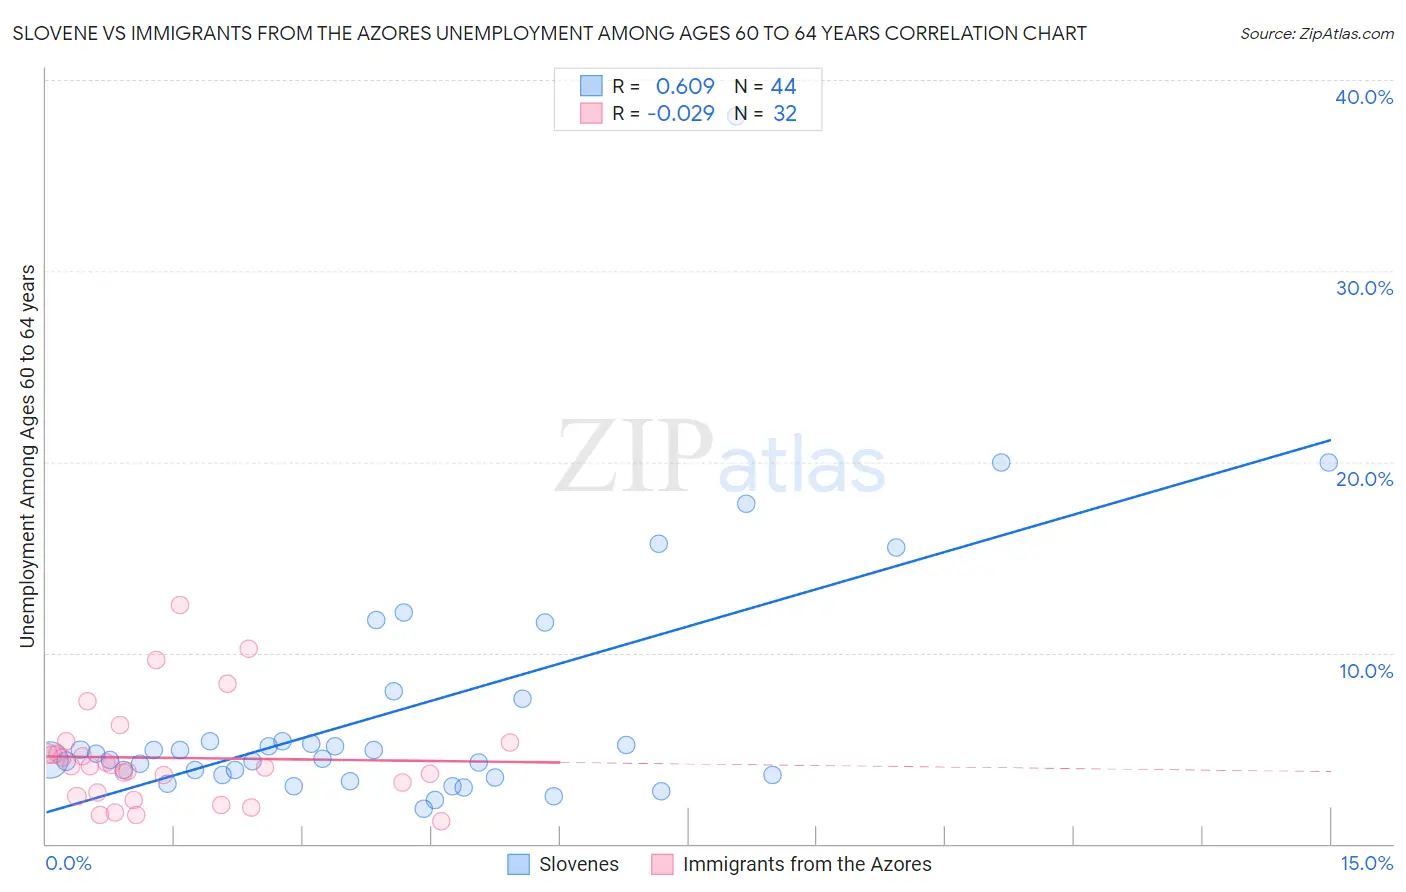
Slovene vs Immigrants from the Azores Unemployment Among Ages 60 to 64 years Correlation Chart
The statistical analysis conducted on geographies consisting of 241,955,713 people shows a significant positive correlation between the proportion of Slovenes and unemployment rate among population between the ages 60 and 64 in the United States with a correlation coefficient (R) of 0.609 and weighted average of 4.4%. Similarly, the statistical analysis conducted on geographies consisting of 44,749,105 people shows no correlation between the proportion of Immigrants from the Azores and unemployment rate among population between the ages 60 and 64 in the United States with a correlation coefficient (R) of -0.029 and weighted average of 4.0%, a difference of 9.1%.
Unemployment Among Ages 60 to 64 years Correlation Summary
| Measurement | Slovene | Immigrants from the Azores |
| Minimum | 1.8% | 1.2% |
| Maximum | 38.1% | 12.5% |
| Range | 36.3% | 11.3% |
| Mean | 7.1% | 4.5% |
| Median | 4.6% | 4.1% |
| Interquartile 25% (IQ1) | 3.6% | 2.6% |
| Interquartile 75% (IQ3) | 6.5% | 5.0% |
| Interquartile Range (IQR) | 2.9% | 2.4% |
| Standard Deviation (Sample) | 6.8% | 2.7% |
| Standard Deviation (Population) | 6.7% | 2.6% |
Demographics Similar to Slovenes and Immigrants from the Azores by Unemployment Among Ages 60 to 64 years
In terms of unemployment among ages 60 to 64 years, the demographic groups most similar to Slovenes are Tsimshian (4.4%, a difference of 0.11%), Afghan (4.4%, a difference of 0.25%), Immigrants from Cabo Verde (4.4%, a difference of 0.25%), Immigrants from Afghanistan (4.4%, a difference of 0.40%), and Danish (4.4%, a difference of 0.56%). Similarly, the demographic groups most similar to Immigrants from the Azores are Hmong (4.0%, a difference of 0.010%), Chinese (4.0%, a difference of 0.43%), Immigrants from Congo (4.1%, a difference of 2.7%), Fijian (3.9%, a difference of 3.3%), and Lumbee (4.2%, a difference of 3.7%).
| Demographics | Rating | Rank | Unemployment Among Ages 60 to 64 years |
| Marshallese | 100.0 /100 | #1 | Exceptional 3.7% |
| Fijians | 100.0 /100 | #2 | Exceptional 3.9% |
| Chinese | 100.0 /100 | #3 | Exceptional 4.0% |
| Hmong | 100.0 /100 | #4 | Exceptional 4.0% |
| Immigrants | Azores | 100.0 /100 | #5 | Exceptional 4.0% |
| Immigrants | Congo | 100.0 /100 | #6 | Exceptional 4.1% |
| Lumbee | 100.0 /100 | #7 | Exceptional 4.2% |
| Immigrants | Micronesia | 100.0 /100 | #8 | Exceptional 4.2% |
| Indonesians | 100.0 /100 | #9 | Exceptional 4.2% |
| Immigrants | Bosnia and Herzegovina | 100.0 /100 | #10 | Exceptional 4.2% |
| Luxembourgers | 100.0 /100 | #11 | Exceptional 4.3% |
| Immigrants | Cuba | 100.0 /100 | #12 | Exceptional 4.3% |
| Chickasaw | 100.0 /100 | #13 | Exceptional 4.3% |
| Norwegians | 100.0 /100 | #14 | Exceptional 4.3% |
| Sudanese | 100.0 /100 | #15 | Exceptional 4.3% |
| Danes | 100.0 /100 | #16 | Exceptional 4.4% |
| Immigrants | Afghanistan | 100.0 /100 | #17 | Exceptional 4.4% |
| Slovenes | 100.0 /100 | #18 | Exceptional 4.4% |
| Tsimshian | 100.0 /100 | #19 | Exceptional 4.4% |
| Afghans | 100.0 /100 | #20 | Exceptional 4.4% |
| Immigrants | Cabo Verde | 100.0 /100 | #21 | Exceptional 4.4% |