Slovene vs Immigrants from Indonesia Bachelor's Degree
COMPARE
Slovene
Immigrants from Indonesia
Bachelor's Degree
Bachelor's Degree Comparison
Slovenes
Immigrants from Indonesia
39.1%
BACHELOR'S DEGREE
79.5/ 100
METRIC RATING
145th/ 347
METRIC RANK
43.3%
BACHELOR'S DEGREE
99.7/ 100
METRIC RATING
68th/ 347
METRIC RANK
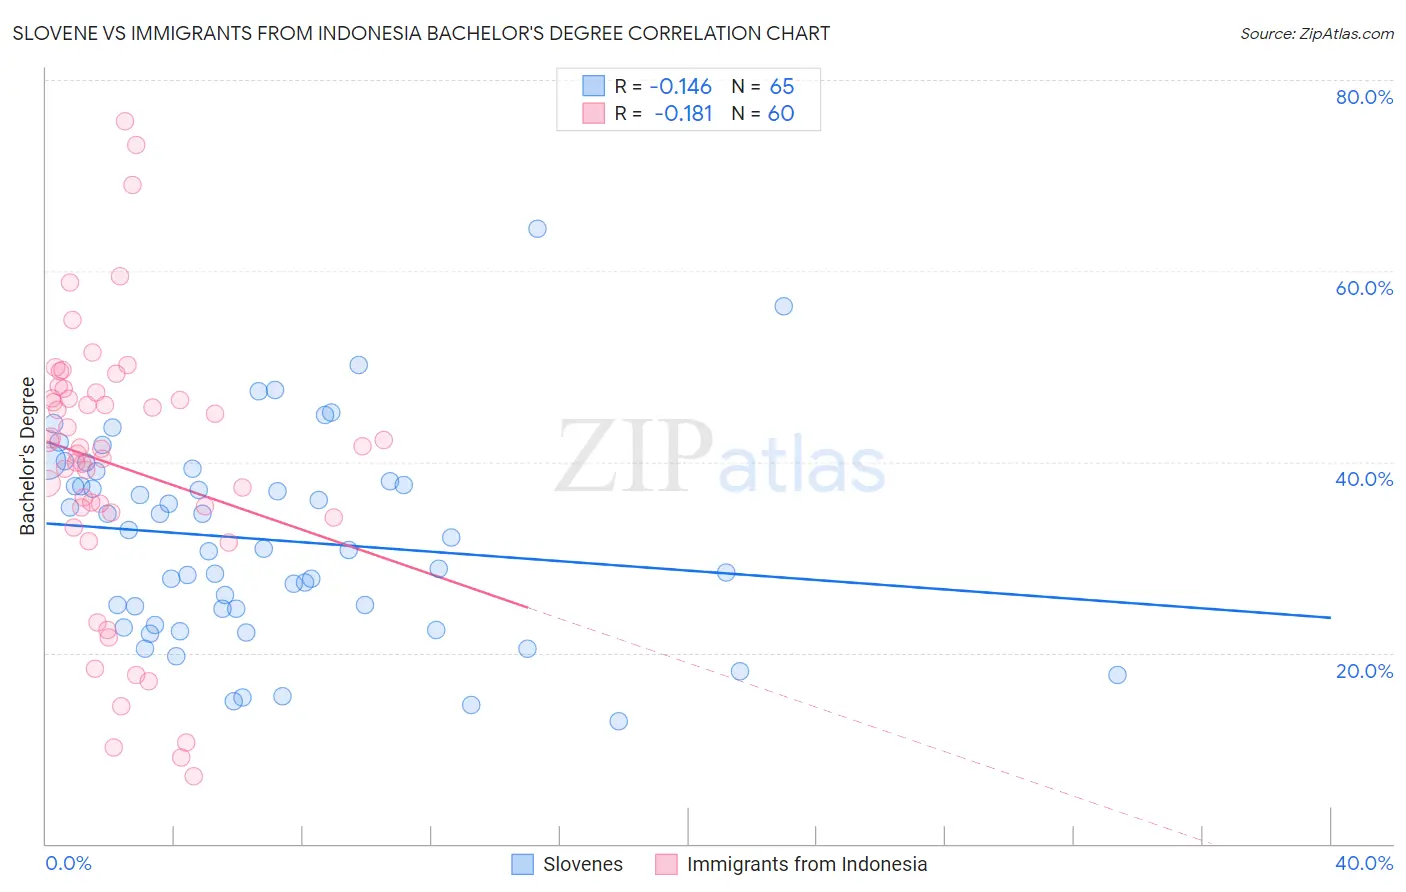
Slovene vs Immigrants from Indonesia Bachelor's Degree Correlation Chart
The statistical analysis conducted on geographies consisting of 261,339,823 people shows a poor negative correlation between the proportion of Slovenes and percentage of population with at least bachelor's degree education in the United States with a correlation coefficient (R) of -0.146 and weighted average of 39.1%. Similarly, the statistical analysis conducted on geographies consisting of 215,775,371 people shows a poor negative correlation between the proportion of Immigrants from Indonesia and percentage of population with at least bachelor's degree education in the United States with a correlation coefficient (R) of -0.181 and weighted average of 43.3%, a difference of 10.7%.
Bachelor's Degree Correlation Summary
| Measurement | Slovene | Immigrants from Indonesia |
| Minimum | 12.8% | 7.0% |
| Maximum | 64.4% | 75.7% |
| Range | 51.7% | 68.7% |
| Mean | 31.8% | 39.5% |
| Median | 30.9% | 41.4% |
| Interquartile 25% (IQ1) | 23.8% | 34.4% |
| Interquartile 75% (IQ3) | 38.5% | 47.0% |
| Interquartile Range (IQR) | 14.7% | 12.6% |
| Standard Deviation (Sample) | 10.6% | 14.6% |
| Standard Deviation (Population) | 10.5% | 14.5% |
Similar Demographics by Bachelor's Degree
Demographics Similar to Slovenes by Bachelor's Degree
In terms of bachelor's degree, the demographic groups most similar to Slovenes are Immigrants from Afghanistan (39.1%, a difference of 0.030%), Swedish (39.1%, a difference of 0.040%), Polish (39.1%, a difference of 0.050%), Immigrants from Sierra Leone (39.0%, a difference of 0.070%), and Iraqi (39.0%, a difference of 0.21%).
| Demographics | Rating | Rank | Bachelor's Degree |
| Europeans | 85.6 /100 | #138 | Excellent 39.5% |
| Immigrants | Sudan | 84.5 /100 | #139 | Excellent 39.4% |
| Immigrants | Armenia | 84.1 /100 | #140 | Excellent 39.4% |
| South American Indians | 83.6 /100 | #141 | Excellent 39.3% |
| Immigrants | North Macedonia | 81.6 /100 | #142 | Excellent 39.2% |
| Poles | 79.8 /100 | #143 | Good 39.1% |
| Immigrants | Afghanistan | 79.7 /100 | #144 | Good 39.1% |
| Slovenes | 79.5 /100 | #145 | Good 39.1% |
| Swedes | 79.2 /100 | #146 | Good 39.1% |
| Immigrants | Sierra Leone | 79.0 /100 | #147 | Good 39.0% |
| Iraqis | 78.1 /100 | #148 | Good 39.0% |
| Immigrants | Poland | 77.5 /100 | #149 | Good 39.0% |
| South Americans | 77.3 /100 | #150 | Good 38.9% |
| Immigrants | Africa | 76.5 /100 | #151 | Good 38.9% |
| Sudanese | 76.4 /100 | #152 | Good 38.9% |
Demographics Similar to Immigrants from Indonesia by Bachelor's Degree
In terms of bachelor's degree, the demographic groups most similar to Immigrants from Indonesia are Egyptian (43.3%, a difference of 0.020%), Immigrants from Netherlands (43.3%, a difference of 0.040%), Zimbabwean (43.3%, a difference of 0.060%), Argentinean (43.3%, a difference of 0.070%), and Immigrants from Pakistan (43.1%, a difference of 0.26%).
| Demographics | Rating | Rank | Bachelor's Degree |
| South Africans | 99.8 /100 | #61 | Exceptional 43.6% |
| Immigrants | Kazakhstan | 99.8 /100 | #62 | Exceptional 43.4% |
| Immigrants | Europe | 99.8 /100 | #63 | Exceptional 43.4% |
| Argentineans | 99.7 /100 | #64 | Exceptional 43.3% |
| Zimbabweans | 99.7 /100 | #65 | Exceptional 43.3% |
| Immigrants | Netherlands | 99.7 /100 | #66 | Exceptional 43.3% |
| Egyptians | 99.7 /100 | #67 | Exceptional 43.3% |
| Immigrants | Indonesia | 99.7 /100 | #68 | Exceptional 43.3% |
| Immigrants | Pakistan | 99.7 /100 | #69 | Exceptional 43.1% |
| Immigrants | Romania | 99.6 /100 | #70 | Exceptional 42.9% |
| Immigrants | Argentina | 99.6 /100 | #71 | Exceptional 42.8% |
| Ethiopians | 99.5 /100 | #72 | Exceptional 42.8% |
| Immigrants | Uzbekistan | 99.5 /100 | #73 | Exceptional 42.8% |
| Bhutanese | 99.5 /100 | #74 | Exceptional 42.7% |
| Immigrants | Zimbabwe | 99.4 /100 | #75 | Exceptional 42.6% |