Slovene vs Immigrants from Central America Bachelor's Degree
COMPARE
Slovene
Immigrants from Central America
Bachelor's Degree
Bachelor's Degree Comparison
Slovenes
Immigrants from Central America
39.1%
BACHELOR'S DEGREE
79.5/ 100
METRIC RATING
145th/ 347
METRIC RANK
27.5%
BACHELOR'S DEGREE
0.0/ 100
METRIC RATING
329th/ 347
METRIC RANK
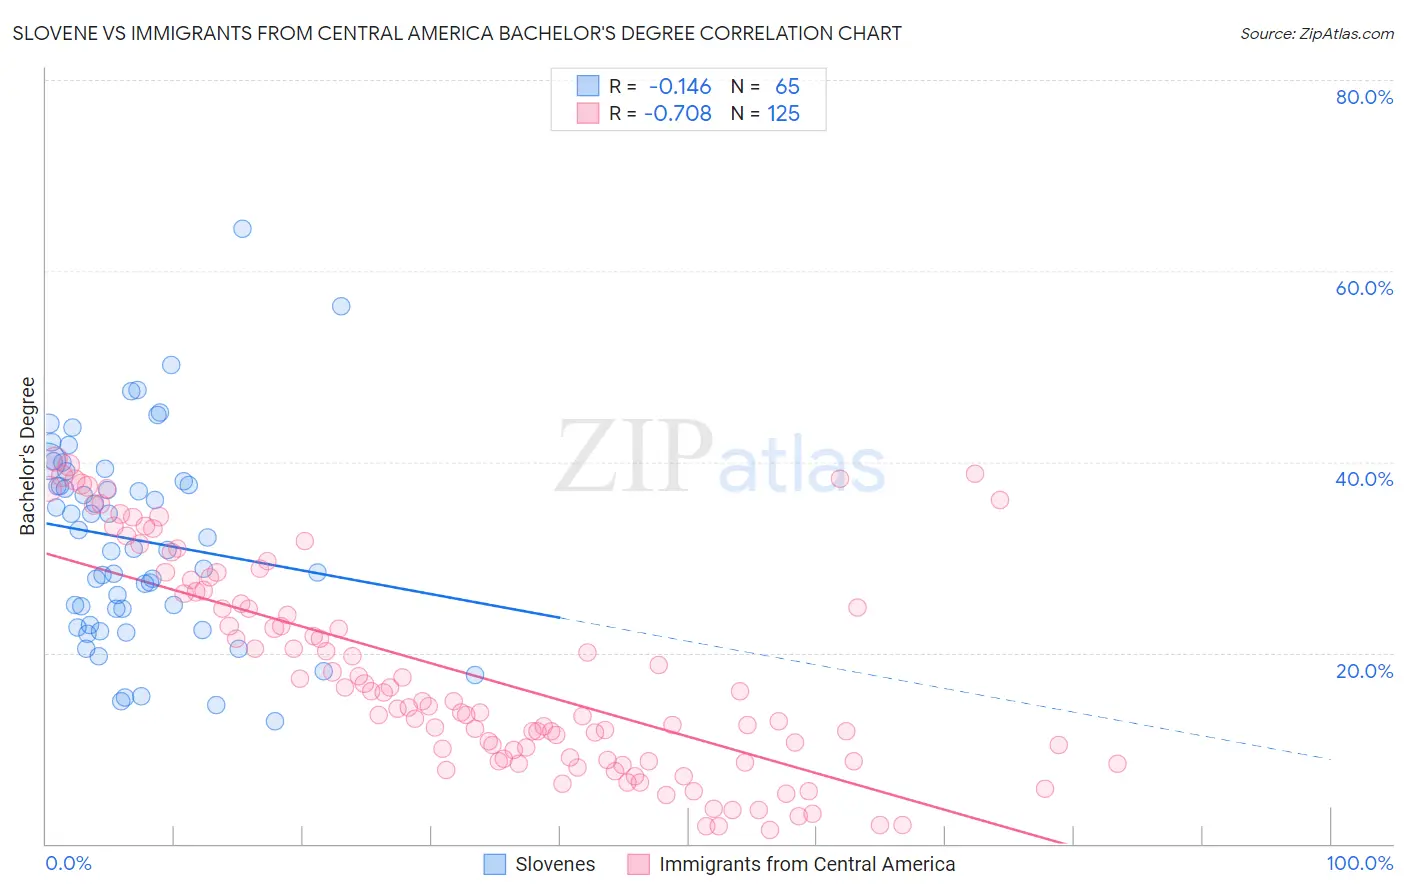
Slovene vs Immigrants from Central America Bachelor's Degree Correlation Chart
The statistical analysis conducted on geographies consisting of 261,339,823 people shows a poor negative correlation between the proportion of Slovenes and percentage of population with at least bachelor's degree education in the United States with a correlation coefficient (R) of -0.146 and weighted average of 39.1%. Similarly, the statistical analysis conducted on geographies consisting of 536,401,370 people shows a strong negative correlation between the proportion of Immigrants from Central America and percentage of population with at least bachelor's degree education in the United States with a correlation coefficient (R) of -0.708 and weighted average of 27.5%, a difference of 42.2%.
Bachelor's Degree Correlation Summary
| Measurement | Slovene | Immigrants from Central America |
| Minimum | 12.8% | 1.4% |
| Maximum | 64.4% | 40.3% |
| Range | 51.7% | 38.8% |
| Mean | 31.8% | 17.9% |
| Median | 30.9% | 14.9% |
| Interquartile 25% (IQ1) | 23.8% | 8.9% |
| Interquartile 75% (IQ3) | 38.5% | 26.5% |
| Interquartile Range (IQR) | 14.7% | 17.6% |
| Standard Deviation (Sample) | 10.6% | 10.9% |
| Standard Deviation (Population) | 10.5% | 10.9% |
Similar Demographics by Bachelor's Degree
Demographics Similar to Slovenes by Bachelor's Degree
In terms of bachelor's degree, the demographic groups most similar to Slovenes are Immigrants from Afghanistan (39.1%, a difference of 0.030%), Swedish (39.1%, a difference of 0.040%), Polish (39.1%, a difference of 0.050%), Immigrants from Sierra Leone (39.0%, a difference of 0.070%), and Iraqi (39.0%, a difference of 0.21%).
| Demographics | Rating | Rank | Bachelor's Degree |
| Europeans | 85.6 /100 | #138 | Excellent 39.5% |
| Immigrants | Sudan | 84.5 /100 | #139 | Excellent 39.4% |
| Immigrants | Armenia | 84.1 /100 | #140 | Excellent 39.4% |
| South American Indians | 83.6 /100 | #141 | Excellent 39.3% |
| Immigrants | North Macedonia | 81.6 /100 | #142 | Excellent 39.2% |
| Poles | 79.8 /100 | #143 | Good 39.1% |
| Immigrants | Afghanistan | 79.7 /100 | #144 | Good 39.1% |
| Slovenes | 79.5 /100 | #145 | Good 39.1% |
| Swedes | 79.2 /100 | #146 | Good 39.1% |
| Immigrants | Sierra Leone | 79.0 /100 | #147 | Good 39.0% |
| Iraqis | 78.1 /100 | #148 | Good 39.0% |
| Immigrants | Poland | 77.5 /100 | #149 | Good 39.0% |
| South Americans | 77.3 /100 | #150 | Good 38.9% |
| Immigrants | Africa | 76.5 /100 | #151 | Good 38.9% |
| Sudanese | 76.4 /100 | #152 | Good 38.9% |
Demographics Similar to Immigrants from Central America by Bachelor's Degree
In terms of bachelor's degree, the demographic groups most similar to Immigrants from Central America are Spanish American Indian (27.5%, a difference of 0.060%), Immigrants from the Azores (27.3%, a difference of 0.54%), Menominee (27.3%, a difference of 0.64%), Crow (27.7%, a difference of 1.0%), and Mexican (27.1%, a difference of 1.5%).
| Demographics | Rating | Rank | Bachelor's Degree |
| Tsimshian | 0.0 /100 | #322 | Tragic 28.8% |
| Fijians | 0.0 /100 | #323 | Tragic 28.7% |
| Dutch West Indians | 0.0 /100 | #324 | Tragic 28.5% |
| Pennsylvania Germans | 0.0 /100 | #325 | Tragic 28.4% |
| Apache | 0.0 /100 | #326 | Tragic 28.3% |
| Paiute | 0.0 /100 | #327 | Tragic 28.1% |
| Crow | 0.0 /100 | #328 | Tragic 27.7% |
| Immigrants | Central America | 0.0 /100 | #329 | Tragic 27.5% |
| Spanish American Indians | 0.0 /100 | #330 | Tragic 27.5% |
| Immigrants | Azores | 0.0 /100 | #331 | Tragic 27.3% |
| Menominee | 0.0 /100 | #332 | Tragic 27.3% |
| Mexicans | 0.0 /100 | #333 | Tragic 27.1% |
| Arapaho | 0.0 /100 | #334 | Tragic 26.6% |
| Natives/Alaskans | 0.0 /100 | #335 | Tragic 26.3% |
| Immigrants | Mexico | 0.0 /100 | #336 | Tragic 26.1% |