Slovak vs Navajo Doctorate Degree
COMPARE
Slovak
Navajo
Doctorate Degree
Doctorate Degree Comparison
Slovaks
Navajo
1.8%
DOCTORATE DEGREE
36.4/ 100
METRIC RATING
185th/ 347
METRIC RANK
1.4%
DOCTORATE DEGREE
0.1/ 100
METRIC RATING
316th/ 347
METRIC RANK
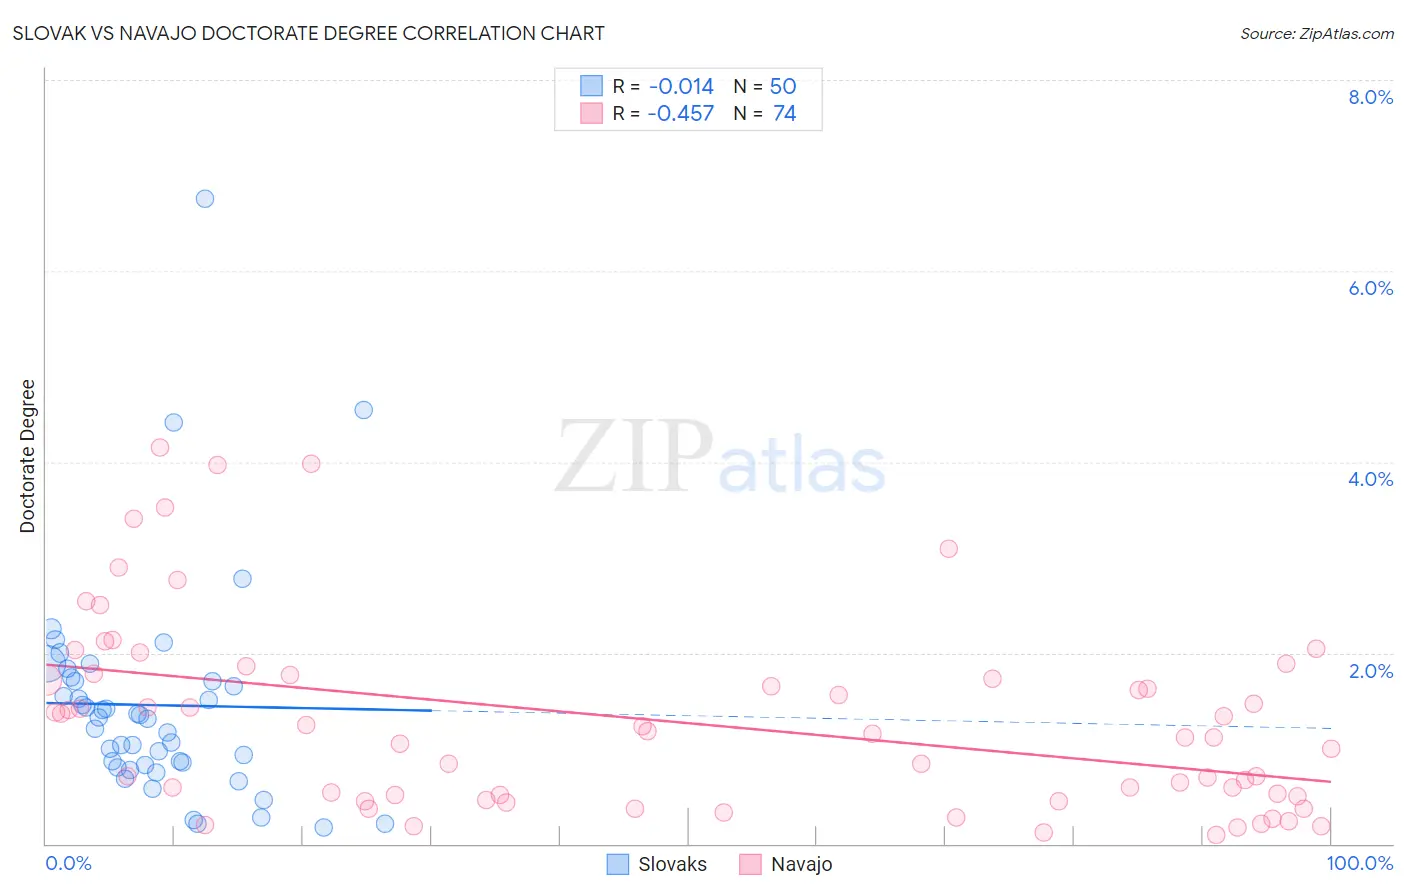
Slovak vs Navajo Doctorate Degree Correlation Chart
The statistical analysis conducted on geographies consisting of 392,855,228 people shows no correlation between the proportion of Slovaks and percentage of population with at least doctorate degree education in the United States with a correlation coefficient (R) of -0.014 and weighted average of 1.8%. Similarly, the statistical analysis conducted on geographies consisting of 222,101,236 people shows a moderate negative correlation between the proportion of Navajo and percentage of population with at least doctorate degree education in the United States with a correlation coefficient (R) of -0.457 and weighted average of 1.4%, a difference of 33.4%.
Doctorate Degree Correlation Summary
| Measurement | Slovak | Navajo |
| Minimum | 0.17% | 0.090% |
| Maximum | 6.8% | 4.2% |
| Range | 6.6% | 4.1% |
| Mean | 1.5% | 1.3% |
| Median | 1.3% | 1.1% |
| Interquartile 25% (IQ1) | 0.83% | 0.50% |
| Interquartile 75% (IQ3) | 1.7% | 1.8% |
| Interquartile Range (IQR) | 0.88% | 1.3% |
| Standard Deviation (Sample) | 1.2% | 1.0% |
| Standard Deviation (Population) | 1.1% | 1.00% |
Similar Demographics by Doctorate Degree
Demographics Similar to Slovaks by Doctorate Degree
In terms of doctorate degree, the demographic groups most similar to Slovaks are Peruvian (1.8%, a difference of 0.32%), Czechoslovakian (1.8%, a difference of 0.55%), Nigerian (1.8%, a difference of 0.57%), Finnish (1.8%, a difference of 0.90%), and German (1.8%, a difference of 1.0%).
| Demographics | Rating | Rank | Doctorate Degree |
| French | 48.8 /100 | #178 | Average 1.8% |
| Ghanaians | 48.3 /100 | #179 | Average 1.8% |
| Scandinavians | 48.0 /100 | #180 | Average 1.8% |
| Immigrants | Immigrants | 46.2 /100 | #181 | Average 1.8% |
| Immigrants | Afghanistan | 44.3 /100 | #182 | Average 1.8% |
| Finns | 42.1 /100 | #183 | Average 1.8% |
| Nigerians | 39.9 /100 | #184 | Fair 1.8% |
| Slovaks | 36.4 /100 | #185 | Fair 1.8% |
| Peruvians | 34.4 /100 | #186 | Fair 1.8% |
| Czechoslovakians | 33.0 /100 | #187 | Fair 1.8% |
| Germans | 30.5 /100 | #188 | Fair 1.8% |
| French Canadians | 30.2 /100 | #189 | Fair 1.8% |
| Immigrants | Costa Rica | 30.2 /100 | #190 | Fair 1.8% |
| South Americans | 29.5 /100 | #191 | Fair 1.8% |
| Dutch | 27.4 /100 | #192 | Fair 1.8% |
Demographics Similar to Navajo by Doctorate Degree
In terms of doctorate degree, the demographic groups most similar to Navajo are Immigrants from the Azores (1.4%, a difference of 0.21%), Dominican (1.4%, a difference of 0.23%), Immigrants from Micronesia (1.3%, a difference of 0.25%), Creek (1.3%, a difference of 0.30%), and Menominee (1.4%, a difference of 0.31%).
| Demographics | Rating | Rank | Doctorate Degree |
| Immigrants | Grenada | 0.1 /100 | #309 | Tragic 1.4% |
| Immigrants | Jamaica | 0.1 /100 | #310 | Tragic 1.4% |
| Immigrants | Honduras | 0.1 /100 | #311 | Tragic 1.4% |
| Immigrants | Nicaragua | 0.1 /100 | #312 | Tragic 1.4% |
| Menominee | 0.1 /100 | #313 | Tragic 1.4% |
| Dominicans | 0.1 /100 | #314 | Tragic 1.4% |
| Immigrants | Azores | 0.1 /100 | #315 | Tragic 1.4% |
| Navajo | 0.1 /100 | #316 | Tragic 1.4% |
| Immigrants | Micronesia | 0.1 /100 | #317 | Tragic 1.3% |
| Creek | 0.1 /100 | #318 | Tragic 1.3% |
| Immigrants | Guyana | 0.1 /100 | #319 | Tragic 1.3% |
| Immigrants | St. Vincent and the Grenadines | 0.1 /100 | #320 | Tragic 1.3% |
| Dutch West Indians | 0.1 /100 | #321 | Tragic 1.3% |
| Seminole | 0.1 /100 | #322 | Tragic 1.3% |
| Immigrants | Belize | 0.1 /100 | #323 | Tragic 1.3% |