Slovak vs Arab Doctorate Degree
COMPARE
Slovak
Arab
Doctorate Degree
Doctorate Degree Comparison
Slovaks
Arabs
1.8%
DOCTORATE DEGREE
36.4/ 100
METRIC RATING
185th/ 347
METRIC RANK
2.1%
DOCTORATE DEGREE
97.8/ 100
METRIC RATING
105th/ 347
METRIC RANK
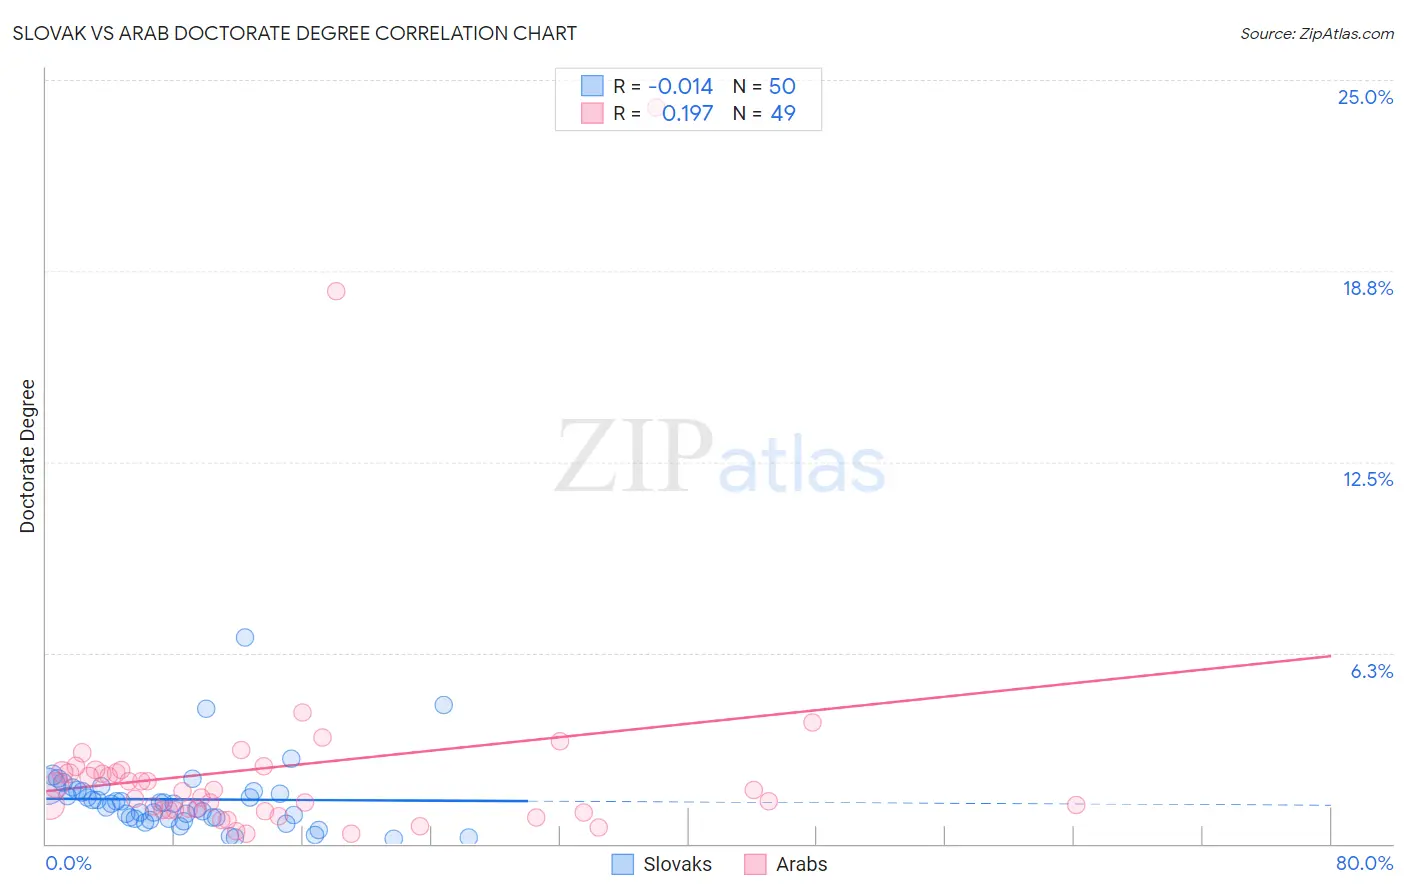
Slovak vs Arab Doctorate Degree Correlation Chart
The statistical analysis conducted on geographies consisting of 392,855,228 people shows no correlation between the proportion of Slovaks and percentage of population with at least doctorate degree education in the United States with a correlation coefficient (R) of -0.014 and weighted average of 1.8%. Similarly, the statistical analysis conducted on geographies consisting of 479,921,881 people shows a poor positive correlation between the proportion of Arabs and percentage of population with at least doctorate degree education in the United States with a correlation coefficient (R) of 0.197 and weighted average of 2.1%, a difference of 16.3%.
Doctorate Degree Correlation Summary
| Measurement | Slovak | Arab |
| Minimum | 0.17% | 0.33% |
| Maximum | 6.8% | 24.1% |
| Range | 6.6% | 23.8% |
| Mean | 1.5% | 2.5% |
| Median | 1.3% | 1.7% |
| Interquartile 25% (IQ1) | 0.83% | 1.1% |
| Interquartile 75% (IQ3) | 1.7% | 2.4% |
| Interquartile Range (IQR) | 0.88% | 1.3% |
| Standard Deviation (Sample) | 1.2% | 4.0% |
| Standard Deviation (Population) | 1.1% | 4.0% |
Similar Demographics by Doctorate Degree
Demographics Similar to Slovaks by Doctorate Degree
In terms of doctorate degree, the demographic groups most similar to Slovaks are Peruvian (1.8%, a difference of 0.32%), Czechoslovakian (1.8%, a difference of 0.55%), Nigerian (1.8%, a difference of 0.57%), Finnish (1.8%, a difference of 0.90%), and German (1.8%, a difference of 1.0%).
| Demographics | Rating | Rank | Doctorate Degree |
| French | 48.8 /100 | #178 | Average 1.8% |
| Ghanaians | 48.3 /100 | #179 | Average 1.8% |
| Scandinavians | 48.0 /100 | #180 | Average 1.8% |
| Immigrants | Immigrants | 46.2 /100 | #181 | Average 1.8% |
| Immigrants | Afghanistan | 44.3 /100 | #182 | Average 1.8% |
| Finns | 42.1 /100 | #183 | Average 1.8% |
| Nigerians | 39.9 /100 | #184 | Fair 1.8% |
| Slovaks | 36.4 /100 | #185 | Fair 1.8% |
| Peruvians | 34.4 /100 | #186 | Fair 1.8% |
| Czechoslovakians | 33.0 /100 | #187 | Fair 1.8% |
| Germans | 30.5 /100 | #188 | Fair 1.8% |
| French Canadians | 30.2 /100 | #189 | Fair 1.8% |
| Immigrants | Costa Rica | 30.2 /100 | #190 | Fair 1.8% |
| South Americans | 29.5 /100 | #191 | Fair 1.8% |
| Dutch | 27.4 /100 | #192 | Fair 1.8% |
Demographics Similar to Arabs by Doctorate Degree
In terms of doctorate degree, the demographic groups most similar to Arabs are Sudanese (2.1%, a difference of 0.10%), Austrian (2.1%, a difference of 0.35%), Romanian (2.1%, a difference of 0.47%), Immigrants from Chile (2.1%, a difference of 0.48%), and European (2.1%, a difference of 0.49%).
| Demographics | Rating | Rank | Doctorate Degree |
| Armenians | 98.3 /100 | #98 | Exceptional 2.1% |
| Immigrants | Egypt | 98.2 /100 | #99 | Exceptional 2.1% |
| Immigrants | Eastern Europe | 98.2 /100 | #100 | Exceptional 2.1% |
| Immigrants | Eastern Africa | 98.2 /100 | #101 | Exceptional 2.1% |
| Immigrants | Chile | 98.1 /100 | #102 | Exceptional 2.1% |
| Romanians | 98.1 /100 | #103 | Exceptional 2.1% |
| Austrians | 98.0 /100 | #104 | Exceptional 2.1% |
| Arabs | 97.8 /100 | #105 | Exceptional 2.1% |
| Sudanese | 97.7 /100 | #106 | Exceptional 2.1% |
| Europeans | 97.5 /100 | #107 | Exceptional 2.1% |
| Immigrants | Germany | 97.3 /100 | #108 | Exceptional 2.1% |
| Ukrainians | 97.2 /100 | #109 | Exceptional 2.1% |
| Brazilians | 97.2 /100 | #110 | Exceptional 2.1% |
| Immigrants | Pakistan | 97.1 /100 | #111 | Exceptional 2.1% |
| Syrians | 97.1 /100 | #112 | Exceptional 2.1% |