Slavic vs Kiowa Bachelor's Degree
COMPARE
Slavic
Kiowa
Bachelor's Degree
Bachelor's Degree Comparison
Slavs
Kiowa
38.9%
BACHELOR'S DEGREE
75.9/ 100
METRIC RATING
153rd/ 347
METRIC RANK
28.8%
BACHELOR'S DEGREE
0.0/ 100
METRIC RATING
320th/ 347
METRIC RANK
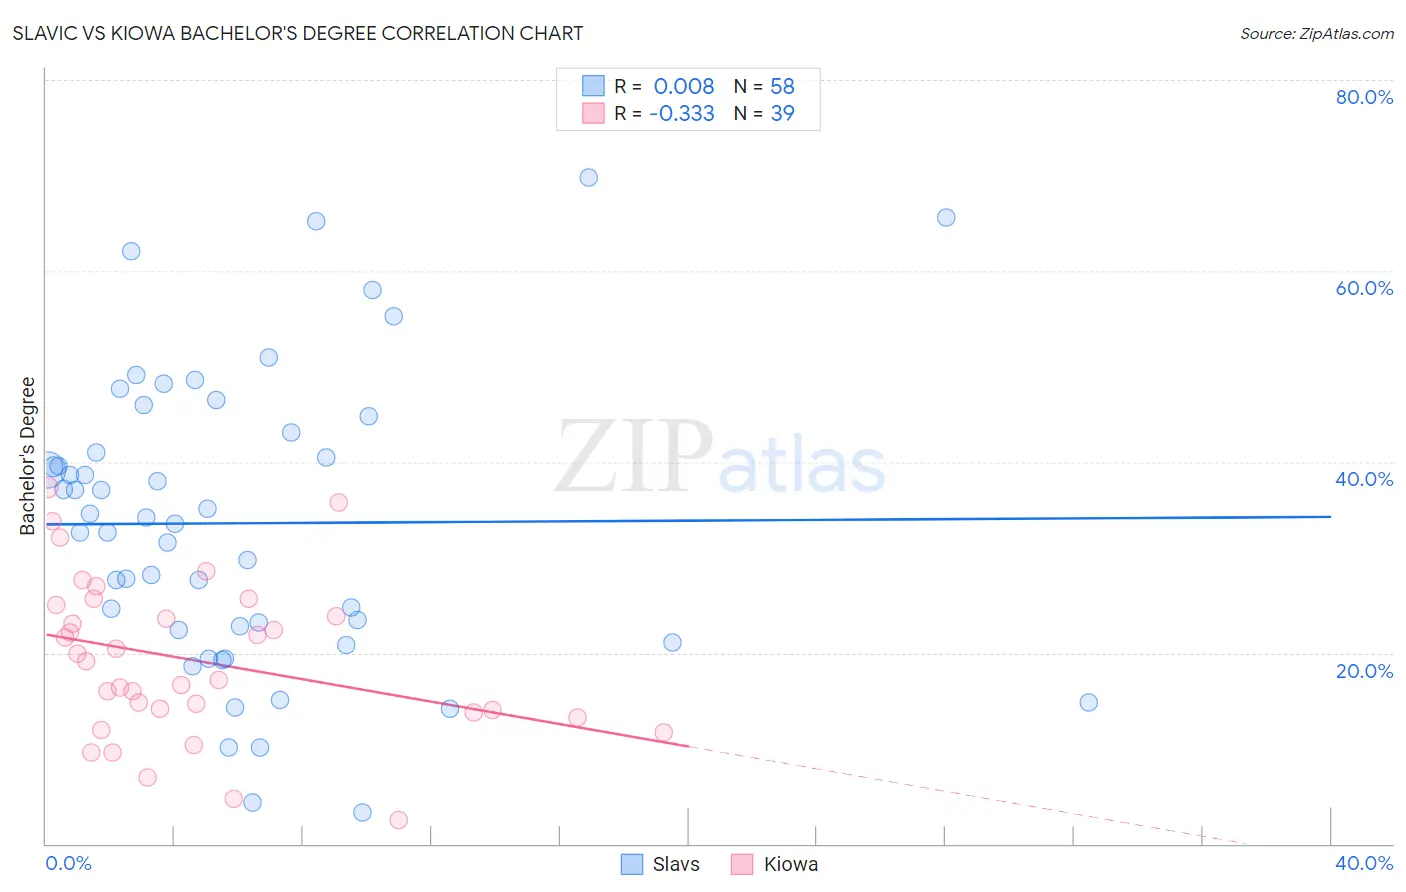
Slavic vs Kiowa Bachelor's Degree Correlation Chart
The statistical analysis conducted on geographies consisting of 270,854,926 people shows no correlation between the proportion of Slavs and percentage of population with at least bachelor's degree education in the United States with a correlation coefficient (R) of 0.008 and weighted average of 38.9%. Similarly, the statistical analysis conducted on geographies consisting of 56,101,363 people shows a mild negative correlation between the proportion of Kiowa and percentage of population with at least bachelor's degree education in the United States with a correlation coefficient (R) of -0.333 and weighted average of 28.8%, a difference of 34.8%.
Bachelor's Degree Correlation Summary
| Measurement | Slavic | Kiowa |
| Minimum | 3.3% | 2.5% |
| Maximum | 69.8% | 37.3% |
| Range | 66.4% | 34.8% |
| Mean | 33.6% | 19.2% |
| Median | 33.9% | 19.1% |
| Interquartile 25% (IQ1) | 22.4% | 13.7% |
| Interquartile 75% (IQ3) | 43.0% | 25.1% |
| Interquartile Range (IQR) | 20.7% | 11.4% |
| Standard Deviation (Sample) | 15.4% | 8.3% |
| Standard Deviation (Population) | 15.3% | 8.2% |
Similar Demographics by Bachelor's Degree
Demographics Similar to Slavs by Bachelor's Degree
In terms of bachelor's degree, the demographic groups most similar to Slavs are Sudanese (38.9%, a difference of 0.060%), Immigrants from Africa (38.9%, a difference of 0.080%), Canadian (38.8%, a difference of 0.12%), South American (38.9%, a difference of 0.18%), and Immigrants from Poland (39.0%, a difference of 0.20%).
| Demographics | Rating | Rank | Bachelor's Degree |
| Swedes | 79.2 /100 | #146 | Good 39.1% |
| Immigrants | Sierra Leone | 79.0 /100 | #147 | Good 39.0% |
| Iraqis | 78.1 /100 | #148 | Good 39.0% |
| Immigrants | Poland | 77.5 /100 | #149 | Good 39.0% |
| South Americans | 77.3 /100 | #150 | Good 38.9% |
| Immigrants | Africa | 76.5 /100 | #151 | Good 38.9% |
| Sudanese | 76.4 /100 | #152 | Good 38.9% |
| Slavs | 75.9 /100 | #153 | Good 38.9% |
| Canadians | 75.0 /100 | #154 | Good 38.8% |
| Immigrants | Kenya | 73.8 /100 | #155 | Good 38.8% |
| Kenyans | 72.5 /100 | #156 | Good 38.7% |
| Immigrants | South America | 70.1 /100 | #157 | Good 38.6% |
| Immigrants | Germany | 69.6 /100 | #158 | Good 38.6% |
| Chinese | 66.6 /100 | #159 | Good 38.5% |
| Vietnamese | 66.6 /100 | #160 | Good 38.5% |
Demographics Similar to Kiowa by Bachelor's Degree
In terms of bachelor's degree, the demographic groups most similar to Kiowa are Creek (28.9%, a difference of 0.040%), Alaskan Athabascan (28.8%, a difference of 0.080%), Tsimshian (28.8%, a difference of 0.30%), Fijian (28.7%, a difference of 0.44%), and Yaqui (29.0%, a difference of 0.50%).
| Demographics | Rating | Rank | Bachelor's Degree |
| Alaska Natives | 0.0 /100 | #313 | Tragic 29.4% |
| Shoshone | 0.0 /100 | #314 | Tragic 29.3% |
| Immigrants | Cabo Verde | 0.0 /100 | #315 | Tragic 29.2% |
| Sioux | 0.0 /100 | #316 | Tragic 29.1% |
| Colville | 0.0 /100 | #317 | Tragic 29.0% |
| Yaqui | 0.0 /100 | #318 | Tragic 29.0% |
| Creek | 0.0 /100 | #319 | Tragic 28.9% |
| Kiowa | 0.0 /100 | #320 | Tragic 28.8% |
| Alaskan Athabascans | 0.0 /100 | #321 | Tragic 28.8% |
| Tsimshian | 0.0 /100 | #322 | Tragic 28.8% |
| Fijians | 0.0 /100 | #323 | Tragic 28.7% |
| Dutch West Indians | 0.0 /100 | #324 | Tragic 28.5% |
| Pennsylvania Germans | 0.0 /100 | #325 | Tragic 28.4% |
| Apache | 0.0 /100 | #326 | Tragic 28.3% |
| Paiute | 0.0 /100 | #327 | Tragic 28.1% |