Slavic vs Assyrian/Chaldean/Syriac Bachelor's Degree
COMPARE
Slavic
Assyrian/Chaldean/Syriac
Bachelor's Degree
Bachelor's Degree Comparison
Slavs
Assyrians/Chaldeans/Syriacs
38.9%
BACHELOR'S DEGREE
75.9/ 100
METRIC RATING
153rd/ 347
METRIC RANK
39.8%
BACHELOR'S DEGREE
89.4/ 100
METRIC RATING
134th/ 347
METRIC RANK
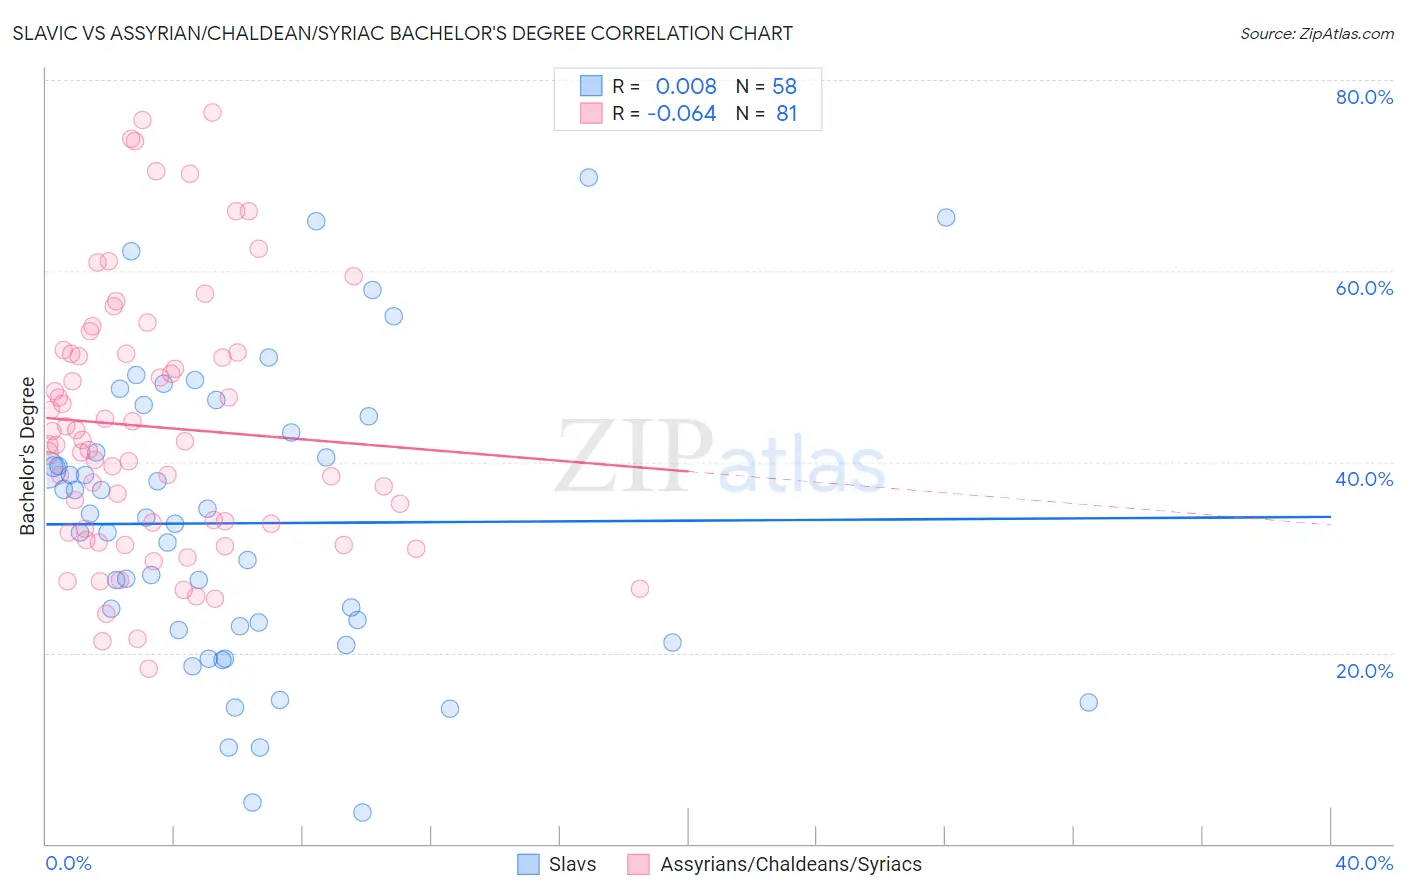
Slavic vs Assyrian/Chaldean/Syriac Bachelor's Degree Correlation Chart
The statistical analysis conducted on geographies consisting of 270,854,926 people shows no correlation between the proportion of Slavs and percentage of population with at least bachelor's degree education in the United States with a correlation coefficient (R) of 0.008 and weighted average of 38.9%. Similarly, the statistical analysis conducted on geographies consisting of 110,314,164 people shows a slight negative correlation between the proportion of Assyrians/Chaldeans/Syriacs and percentage of population with at least bachelor's degree education in the United States with a correlation coefficient (R) of -0.064 and weighted average of 39.8%, a difference of 2.3%.
Bachelor's Degree Correlation Summary
| Measurement | Slavic | Assyrian/Chaldean/Syriac |
| Minimum | 3.3% | 18.3% |
| Maximum | 69.8% | 76.7% |
| Range | 66.4% | 58.4% |
| Mean | 33.6% | 43.7% |
| Median | 33.9% | 41.8% |
| Interquartile 25% (IQ1) | 22.4% | 32.8% |
| Interquartile 75% (IQ3) | 43.0% | 51.4% |
| Interquartile Range (IQR) | 20.7% | 18.6% |
| Standard Deviation (Sample) | 15.4% | 13.8% |
| Standard Deviation (Population) | 15.3% | 13.7% |
Demographics Similar to Slavs and Assyrians/Chaldeans/Syriacs by Bachelor's Degree
In terms of bachelor's degree, the demographic groups most similar to Slavs are Sudanese (38.9%, a difference of 0.060%), Immigrants from Africa (38.9%, a difference of 0.080%), South American (38.9%, a difference of 0.18%), Immigrants from Poland (39.0%, a difference of 0.20%), and Iraqi (39.0%, a difference of 0.28%). Similarly, the demographic groups most similar to Assyrians/Chaldeans/Syriacs are Luxembourger (39.8%, a difference of 0.080%), Pakistani (39.7%, a difference of 0.28%), Immigrants from Southern Europe (40.0%, a difference of 0.43%), Icelander (39.5%, a difference of 0.65%), and European (39.5%, a difference of 0.82%).
| Demographics | Rating | Rank | Bachelor's Degree |
| Immigrants | Southern Europe | 91.1 /100 | #133 | Exceptional 40.0% |
| Assyrians/Chaldeans/Syriacs | 89.4 /100 | #134 | Excellent 39.8% |
| Luxembourgers | 89.1 /100 | #135 | Excellent 39.8% |
| Pakistanis | 88.2 /100 | #136 | Excellent 39.7% |
| Icelanders | 86.5 /100 | #137 | Excellent 39.5% |
| Europeans | 85.6 /100 | #138 | Excellent 39.5% |
| Immigrants | Sudan | 84.5 /100 | #139 | Excellent 39.4% |
| Immigrants | Armenia | 84.1 /100 | #140 | Excellent 39.4% |
| South American Indians | 83.6 /100 | #141 | Excellent 39.3% |
| Immigrants | North Macedonia | 81.6 /100 | #142 | Excellent 39.2% |
| Poles | 79.8 /100 | #143 | Good 39.1% |
| Immigrants | Afghanistan | 79.7 /100 | #144 | Good 39.1% |
| Slovenes | 79.5 /100 | #145 | Good 39.1% |
| Swedes | 79.2 /100 | #146 | Good 39.1% |
| Immigrants | Sierra Leone | 79.0 /100 | #147 | Good 39.0% |
| Iraqis | 78.1 /100 | #148 | Good 39.0% |
| Immigrants | Poland | 77.5 /100 | #149 | Good 39.0% |
| South Americans | 77.3 /100 | #150 | Good 38.9% |
| Immigrants | Africa | 76.5 /100 | #151 | Good 38.9% |
| Sudanese | 76.4 /100 | #152 | Good 38.9% |
| Slavs | 75.9 /100 | #153 | Good 38.9% |