Slavic vs Immigrants from Kuwait Associate's Degree
COMPARE
Slavic
Immigrants from Kuwait
Associate's Degree
Associate's Degree Comparison
Slavs
Immigrants from Kuwait
47.6%
ASSOCIATE'S DEGREE
80.5/ 100
METRIC RATING
144th/ 347
METRIC RANK
52.4%
ASSOCIATE'S DEGREE
99.9/ 100
METRIC RATING
47th/ 347
METRIC RANK
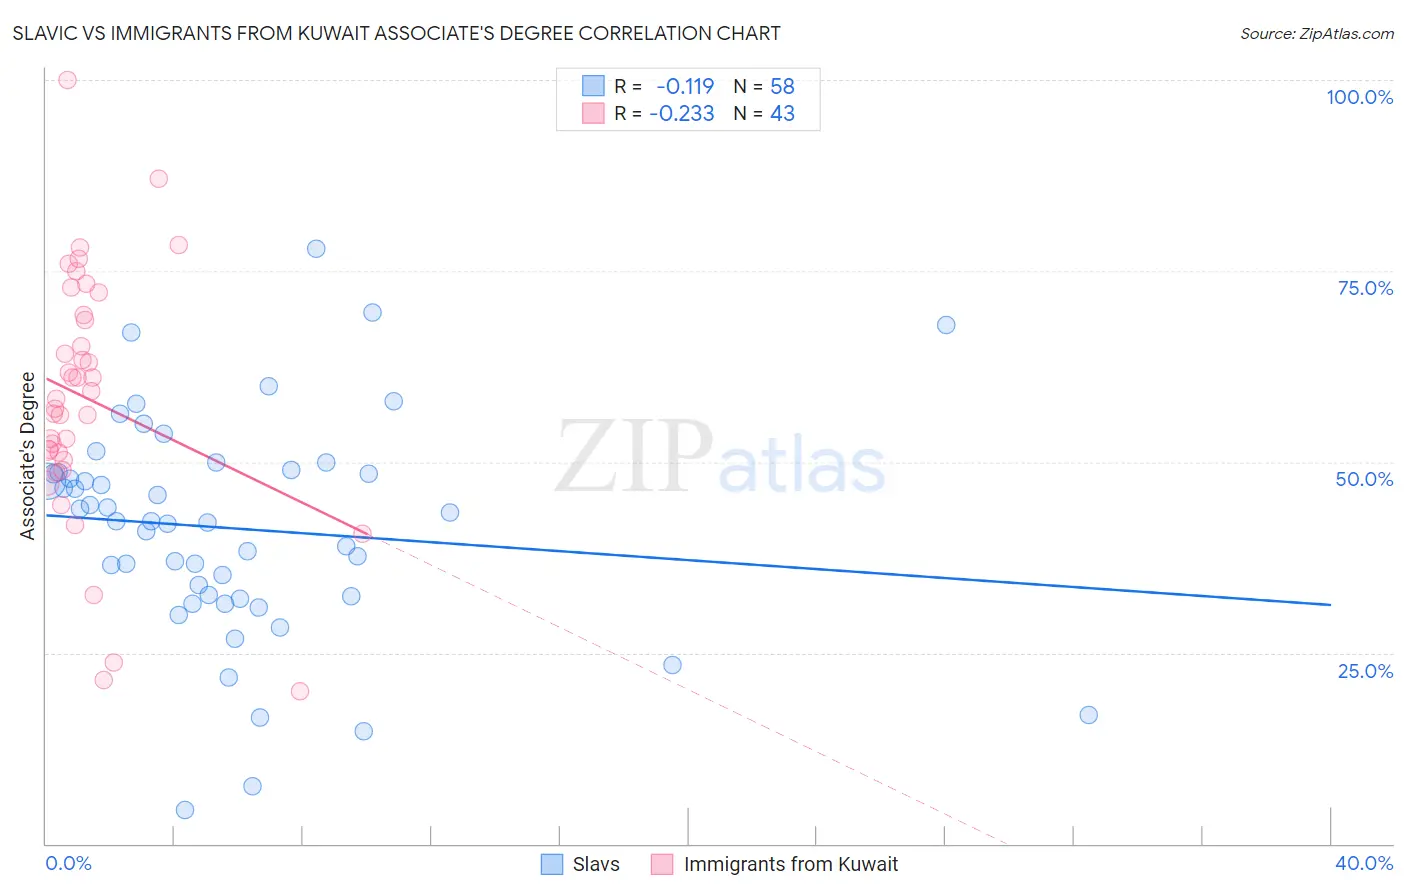
Slavic vs Immigrants from Kuwait Associate's Degree Correlation Chart
The statistical analysis conducted on geographies consisting of 270,857,776 people shows a poor negative correlation between the proportion of Slavs and percentage of population with at least associate's degree education in the United States with a correlation coefficient (R) of -0.119 and weighted average of 47.6%. Similarly, the statistical analysis conducted on geographies consisting of 136,917,085 people shows a weak negative correlation between the proportion of Immigrants from Kuwait and percentage of population with at least associate's degree education in the United States with a correlation coefficient (R) of -0.233 and weighted average of 52.4%, a difference of 10.1%.
Associate's Degree Correlation Summary
| Measurement | Slavic | Immigrants from Kuwait |
| Minimum | 4.4% | 19.9% |
| Maximum | 77.9% | 100.0% |
| Range | 73.5% | 80.1% |
| Mean | 41.3% | 58.2% |
| Median | 42.2% | 58.2% |
| Interquartile 25% (IQ1) | 32.4% | 50.2% |
| Interquartile 75% (IQ3) | 48.7% | 69.3% |
| Interquartile Range (IQR) | 16.3% | 19.1% |
| Standard Deviation (Sample) | 14.5% | 16.5% |
| Standard Deviation (Population) | 14.4% | 16.3% |
Similar Demographics by Associate's Degree
Demographics Similar to Slavs by Associate's Degree
In terms of associate's degree, the demographic groups most similar to Slavs are Norwegian (47.6%, a difference of 0.060%), Canadian (47.5%, a difference of 0.17%), Sierra Leonean (47.7%, a difference of 0.29%), Immigrants from Sudan (47.4%, a difference of 0.30%), and Taiwanese (47.7%, a difference of 0.34%).
| Demographics | Rating | Rank | Associate's Degree |
| Immigrants | Eritrea | 87.8 /100 | #137 | Excellent 48.1% |
| Poles | 87.3 /100 | #138 | Excellent 48.0% |
| Slovenes | 85.1 /100 | #139 | Excellent 47.9% |
| Immigrants | Southern Europe | 84.4 /100 | #140 | Excellent 47.8% |
| Taiwanese | 83.3 /100 | #141 | Excellent 47.7% |
| Sierra Leoneans | 82.9 /100 | #142 | Excellent 47.7% |
| Norwegians | 81.0 /100 | #143 | Excellent 47.6% |
| Slavs | 80.5 /100 | #144 | Excellent 47.6% |
| Canadians | 79.0 /100 | #145 | Good 47.5% |
| Immigrants | Sudan | 77.9 /100 | #146 | Good 47.4% |
| Danes | 77.3 /100 | #147 | Good 47.4% |
| South American Indians | 76.7 /100 | #148 | Good 47.4% |
| Immigrants | Armenia | 76.6 /100 | #149 | Good 47.4% |
| Iraqis | 76.2 /100 | #150 | Good 47.4% |
| Immigrants | North Macedonia | 76.0 /100 | #151 | Good 47.4% |
Demographics Similar to Immigrants from Kuwait by Associate's Degree
In terms of associate's degree, the demographic groups most similar to Immigrants from Kuwait are Immigrants from Bulgaria (52.4%, a difference of 0.010%), Immigrants from Lithuania (52.4%, a difference of 0.14%), Estonian (52.5%, a difference of 0.22%), Immigrants from Norway (52.2%, a difference of 0.26%), and Immigrants from South Africa (52.5%, a difference of 0.31%).
| Demographics | Rating | Rank | Associate's Degree |
| Immigrants | Latvia | 99.9 /100 | #40 | Exceptional 52.8% |
| Immigrants | Saudi Arabia | 99.9 /100 | #41 | Exceptional 52.6% |
| Immigrants | Malaysia | 99.9 /100 | #42 | Exceptional 52.5% |
| Immigrants | South Africa | 99.9 /100 | #43 | Exceptional 52.5% |
| Estonians | 99.9 /100 | #44 | Exceptional 52.5% |
| Immigrants | Lithuania | 99.9 /100 | #45 | Exceptional 52.4% |
| Immigrants | Bulgaria | 99.9 /100 | #46 | Exceptional 52.4% |
| Immigrants | Kuwait | 99.9 /100 | #47 | Exceptional 52.4% |
| Immigrants | Norway | 99.9 /100 | #48 | Exceptional 52.2% |
| Immigrants | Austria | 99.9 /100 | #49 | Exceptional 52.1% |
| Asians | 99.9 /100 | #50 | Exceptional 52.1% |
| Immigrants | Greece | 99.9 /100 | #51 | Exceptional 52.1% |
| Bolivians | 99.8 /100 | #52 | Exceptional 52.0% |
| Immigrants | Asia | 99.8 /100 | #53 | Exceptional 52.0% |
| Immigrants | Spain | 99.8 /100 | #54 | Exceptional 51.9% |