Slavic vs Scottish Associate's Degree
COMPARE
Slavic
Scottish
Associate's Degree
Associate's Degree Comparison
Slavs
Scottish
47.6%
ASSOCIATE'S DEGREE
80.5/ 100
METRIC RATING
144th/ 347
METRIC RANK
46.9%
ASSOCIATE'S DEGREE
65.4/ 100
METRIC RATING
160th/ 347
METRIC RANK
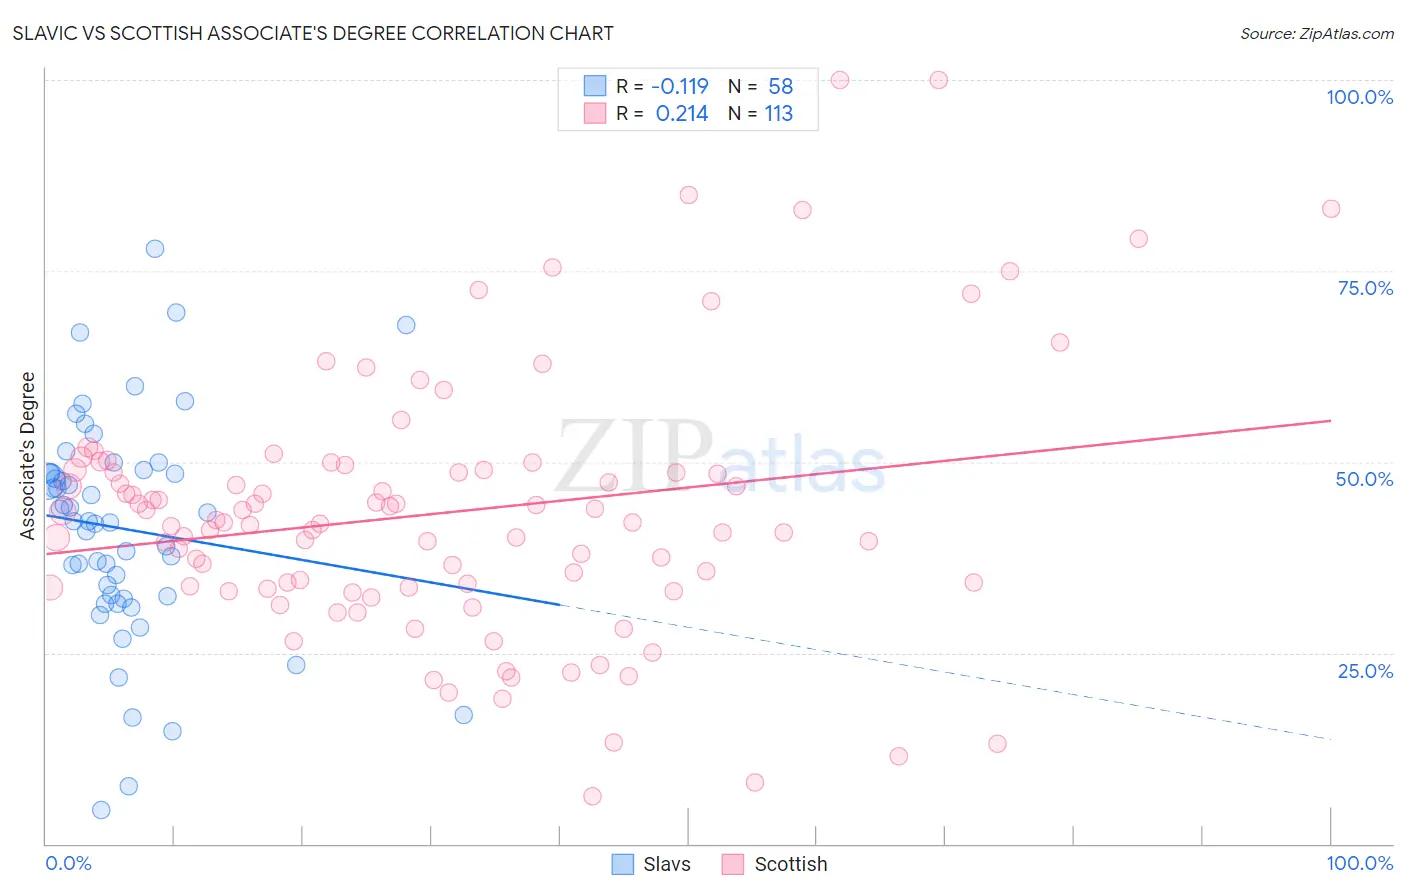
Slavic vs Scottish Associate's Degree Correlation Chart
The statistical analysis conducted on geographies consisting of 270,857,776 people shows a poor negative correlation between the proportion of Slavs and percentage of population with at least associate's degree education in the United States with a correlation coefficient (R) of -0.119 and weighted average of 47.6%. Similarly, the statistical analysis conducted on geographies consisting of 567,065,260 people shows a weak positive correlation between the proportion of Scottish and percentage of population with at least associate's degree education in the United States with a correlation coefficient (R) of 0.214 and weighted average of 46.9%, a difference of 1.4%.
Associate's Degree Correlation Summary
| Measurement | Slavic | Scottish |
| Minimum | 4.4% | 6.2% |
| Maximum | 77.9% | 100.0% |
| Range | 73.5% | 93.7% |
| Mean | 41.3% | 43.3% |
| Median | 42.2% | 42.0% |
| Interquartile 25% (IQ1) | 32.4% | 33.6% |
| Interquartile 75% (IQ3) | 48.7% | 49.0% |
| Interquartile Range (IQR) | 16.3% | 15.4% |
| Standard Deviation (Sample) | 14.5% | 17.2% |
| Standard Deviation (Population) | 14.4% | 17.1% |
Demographics Similar to Slavs and Scottish by Associate's Degree
In terms of associate's degree, the demographic groups most similar to Slavs are Norwegian (47.6%, a difference of 0.060%), Canadian (47.5%, a difference of 0.17%), Sierra Leonean (47.7%, a difference of 0.29%), Immigrants from Sudan (47.4%, a difference of 0.30%), and Danish (47.4%, a difference of 0.35%). Similarly, the demographic groups most similar to Scottish are Scandinavian (46.9%, a difference of 0.020%), Immigrants from Africa (46.8%, a difference of 0.18%), Immigrants from Poland (47.1%, a difference of 0.31%), Immigrants from Germany (47.1%, a difference of 0.36%), and Sudanese (47.1%, a difference of 0.41%).
| Demographics | Rating | Rank | Associate's Degree |
| Sierra Leoneans | 82.9 /100 | #142 | Excellent 47.7% |
| Norwegians | 81.0 /100 | #143 | Excellent 47.6% |
| Slavs | 80.5 /100 | #144 | Excellent 47.6% |
| Canadians | 79.0 /100 | #145 | Good 47.5% |
| Immigrants | Sudan | 77.9 /100 | #146 | Good 47.4% |
| Danes | 77.3 /100 | #147 | Good 47.4% |
| South American Indians | 76.7 /100 | #148 | Good 47.4% |
| Immigrants | Armenia | 76.6 /100 | #149 | Good 47.4% |
| Iraqis | 76.2 /100 | #150 | Good 47.4% |
| Immigrants | North Macedonia | 76.0 /100 | #151 | Good 47.4% |
| Immigrants | Afghanistan | 74.3 /100 | #152 | Good 47.3% |
| Czechs | 72.2 /100 | #153 | Good 47.2% |
| Immigrants | Kenya | 72.1 /100 | #154 | Good 47.2% |
| Kenyans | 70.6 /100 | #155 | Good 47.1% |
| South Americans | 70.5 /100 | #156 | Good 47.1% |
| Sudanese | 70.3 /100 | #157 | Good 47.1% |
| Immigrants | Germany | 69.7 /100 | #158 | Good 47.1% |
| Immigrants | Poland | 69.2 /100 | #159 | Good 47.1% |
| Scottish | 65.4 /100 | #160 | Good 46.9% |
| Scandinavians | 65.2 /100 | #161 | Good 46.9% |
| Immigrants | Africa | 63.2 /100 | #162 | Good 46.8% |