Slavic vs Immigrants from Belize 9th Grade

COMPARE

Slavic
Race
Ancestry
AfghanAfricanAlaska NativeAlaskan AthabascanAlbanianAleutAlsatianAmericanApacheArabArapahoArgentineanArmenianAssyrian/Chaldean/SyriacAustralianAustrianBahamianBangladeshiBarbadianBasqueBelgianBelizeanBermudanBhutaneseBlackfeetBolivianBrazilianBritishBritish West IndianBulgarianBurmeseCajunCambodianCanadianCape VerdeanCarpatho RusynCelticCentral AmericanCentral American IndianCherokeeCheyenneChickasawChileanChineseChippewaChoctawColombianColvilleComancheCosta RicanCreeCreekCroatianCrowCubanCypriotCzechCzechoslovakianDanishDelawareDominicanDutchDutch West IndianEastern EuropeanEcuadorianEgyptianEnglishEstonianEthiopianEuropeanFijianFilipinoFinnishFrenchFrench American IndianFrench CanadianGermanGerman RussianGhanaianGreekGuamanian/ChamorroGuatemalanGuyaneseHaitianHmongHonduranHopiHoumaHungarianIcelanderIndian (Asian)IndonesianInupiatIranianIraqiIrishIroquoisIsraeliItalianJamaicanJapaneseJordanianKenyanKiowaKoreanLaotianLatvianLebaneseLiberianLithuanianLumbeeLuxembourgerMacedonianMalaysianMalteseMarshalleseMenomineeMexicanMexican American IndianMongolianMoroccanNative HawaiianNavajoNepaleseNew ZealanderNicaraguanNigerianNorthern EuropeanNorwegianOkinawanOsageOttawaPaiutePakistaniPalestinianPanamanianParaguayanPennsylvania GermanPeruvianPimaPolishPortuguesePotawatomiPuebloPuerto RicanPuget Sound SalishRomanianRussianSalvadoranSamoanScandinavianScotch-IrishScottishSeminoleSenegaleseSerbianShoshoneSierra LeoneanSiouxSlavicSlovakSloveneSomaliSouth AfricanSouth AmericanSouth American IndianSoviet UnionSpaniardSpanishSpanish AmericanSpanish American IndianSri LankanSubsaharan AfricanSudaneseSwedishSwissSyrianTaiwaneseThaiTlingit-HaidaTohono O'OdhamTonganTrinidadian and TobagonianTsimshianTurkishU.S. Virgin IslanderUgandanUkrainianUruguayanUteVenezuelanVietnameseWelshWest IndianYakamaYaquiYugoslavianYumanYup'ikZimbabwean
Immigration
NonimmigrantsImmigrantsAfghanistanAfricaAlbaniaArgentinaArmeniaAsiaAustraliaAustriaBahamasBangladeshBarbadosBelarusBelgiumBoliviaBosnia and HerzegovinaBrazilBulgariaBurma/MyanmarCabo VerdeCambodiaCameroonCanadaCaribbeanCentral AmericaChileChinaColombiaCongoCosta RicaCroatiaCubaCzechoslovakiaDenmarkDominicaDominican RepublicEastern AfricaEastern AsiaEastern EuropeEcuadorEgyptEl SalvadorEnglandEritreaEthiopiaEuropeFijiFranceGermanyGhanaGreeceGrenadaGuatemalaGuyanaHaitiHondurasHong KongHungaryIndiaIndonesiaIranIraqIrelandIsraelItalyJamaicaJapanJordanKazakhstanKenyaKoreaKuwaitLaosLatin AmericaLatviaLebanonLiberiaLithuaniaMalaysiaMexicoMicronesiaMiddle AfricaMoldovaMoroccoNepalNetherlandsNicaraguaNigeriaNorth AmericaNorth MacedoniaNorthern AfricaNorthern EuropeNorwayOceaniaPakistanPanamaPeruPhilippinesPolandPortugalRomaniaRussiaSaudi ArabiaScotlandSenegalSerbiaSierra LeoneSingaporeSomaliaSouth AfricaSouth AmericaSouth Central AsiaSouth Eastern AsiaSouthern EuropeSpainSri LankaSt. Vincent and the GrenadinesSudanSwedenSwitzerlandSyriaTaiwanThailandTrinidad and TobagoTurkeyUgandaUkraineUruguayUzbekistanVenezuelaVietnamWest IndiesWestern AfricaWestern AsiaWestern EuropeYemenZaireZimbabweAzores
Immigrants from Belize
Race
Ancestry
AfghanAfricanAlaska NativeAlaskan AthabascanAlbanianAleutAlsatianAmericanApacheArabArapahoArgentineanArmenianAssyrian/Chaldean/SyriacAustralianAustrianBahamianBangladeshiBarbadianBasqueBelgianBelizeanBermudanBhutaneseBlackfeetBolivianBrazilianBritishBritish West IndianBulgarianBurmeseCajunCambodianCanadianCape VerdeanCarpatho RusynCelticCentral AmericanCentral American IndianCherokeeCheyenneChickasawChileanChineseChippewaChoctawColombianColvilleComancheCosta RicanCreeCreekCroatianCrowCubanCypriotCzechCzechoslovakianDanishDelawareDominicanDutchDutch West IndianEastern EuropeanEcuadorianEgyptianEnglishEstonianEthiopianEuropeanFijianFilipinoFinnishFrenchFrench American IndianFrench CanadianGermanGerman RussianGhanaianGreekGuamanian/ChamorroGuatemalanGuyaneseHaitianHmongHonduranHopiHoumaHungarianIcelanderIndian (Asian)IndonesianInupiatIranianIraqiIrishIroquoisIsraeliItalianJamaicanJapaneseJordanianKenyanKiowaKoreanLaotianLatvianLebaneseLiberianLithuanianLumbeeLuxembourgerMacedonianMalaysianMalteseMarshalleseMenomineeMexicanMexican American IndianMongolianMoroccanNative HawaiianNavajoNepaleseNew ZealanderNicaraguanNigerianNorthern EuropeanNorwegianOkinawanOsageOttawaPaiutePakistaniPalestinianPanamanianParaguayanPennsylvania GermanPeruvianPimaPolishPortuguesePotawatomiPuebloPuerto RicanPuget Sound SalishRomanianRussianSalvadoranSamoanScandinavianScotch-IrishScottishSeminoleSenegaleseSerbianShoshoneSierra LeoneanSiouxSlovakSloveneSomaliSouth AfricanSouth AmericanSouth American IndianSoviet UnionSpaniardSpanishSpanish AmericanSpanish American IndianSri LankanSubsaharan AfricanSudaneseSwedishSwissSyrianTaiwaneseThaiTlingit-HaidaTohono O'OdhamTonganTrinidadian and TobagonianTsimshianTurkishU.S. Virgin IslanderUgandanUkrainianUruguayanUteVenezuelanVietnameseWelshWest IndianYakamaYaquiYugoslavianYumanYup'ikZimbabwean
Immigration
NonimmigrantsImmigrantsAfghanistanAfricaAlbaniaArgentinaArmeniaAsiaAustraliaAustriaBahamasBangladeshBarbadosBelarusBelgiumBelizeBoliviaBosnia and HerzegovinaBrazilBulgariaBurma/MyanmarCabo VerdeCambodiaCameroonCanadaCaribbeanCentral AmericaChileChinaColombiaCongoCosta RicaCroatiaCubaCzechoslovakiaDenmarkDominicaDominican RepublicEastern AfricaEastern AsiaEastern EuropeEcuadorEgyptEl SalvadorEnglandEritreaEthiopiaEuropeFijiFranceGermanyGhanaGreeceGrenadaGuatemalaGuyanaHaitiHondurasHong KongHungaryIndiaIndonesiaIranIraqIrelandIsraelItalyJamaicaJapanJordanKazakhstanKenyaKoreaKuwaitLaosLatin AmericaLatviaLebanonLiberiaLithuaniaMalaysiaMexicoMicronesiaMiddle AfricaMoldovaMoroccoNepalNetherlandsNicaraguaNigeriaNorth AmericaNorth MacedoniaNorthern AfricaNorthern EuropeNorwayOceaniaPakistanPanamaPeruPhilippinesPolandPortugalRomaniaRussiaSaudi ArabiaScotlandSenegalSerbiaSierra LeoneSingaporeSomaliaSouth AfricaSouth AmericaSouth Central AsiaSouth Eastern AsiaSouthern EuropeSpainSri LankaSt. Vincent and the GrenadinesSudanSwedenSwitzerlandSyriaTaiwanThailandTrinidad and TobagoTurkeyUgandaUkraineUruguayUzbekistanVenezuelaVietnamWest IndiesWestern AfricaWestern AsiaWestern EuropeYemenZaireZimbabweAzores
9th Grade
Income
Poverty
Unemployment
Labor Participation
Family Structure
Vehicle Availability
Education Level
Disability

9th Grade Comparison

Slavs

Immigrants from Belize

Exceptional
Tragic
96.1%
9TH GRADE
99.9/ 100
METRIC RATING
40th/ 347
METRIC RANK
91.8%
9TH GRADE
0.0/ 100
METRIC RATING
324th/ 347
METRIC RANK

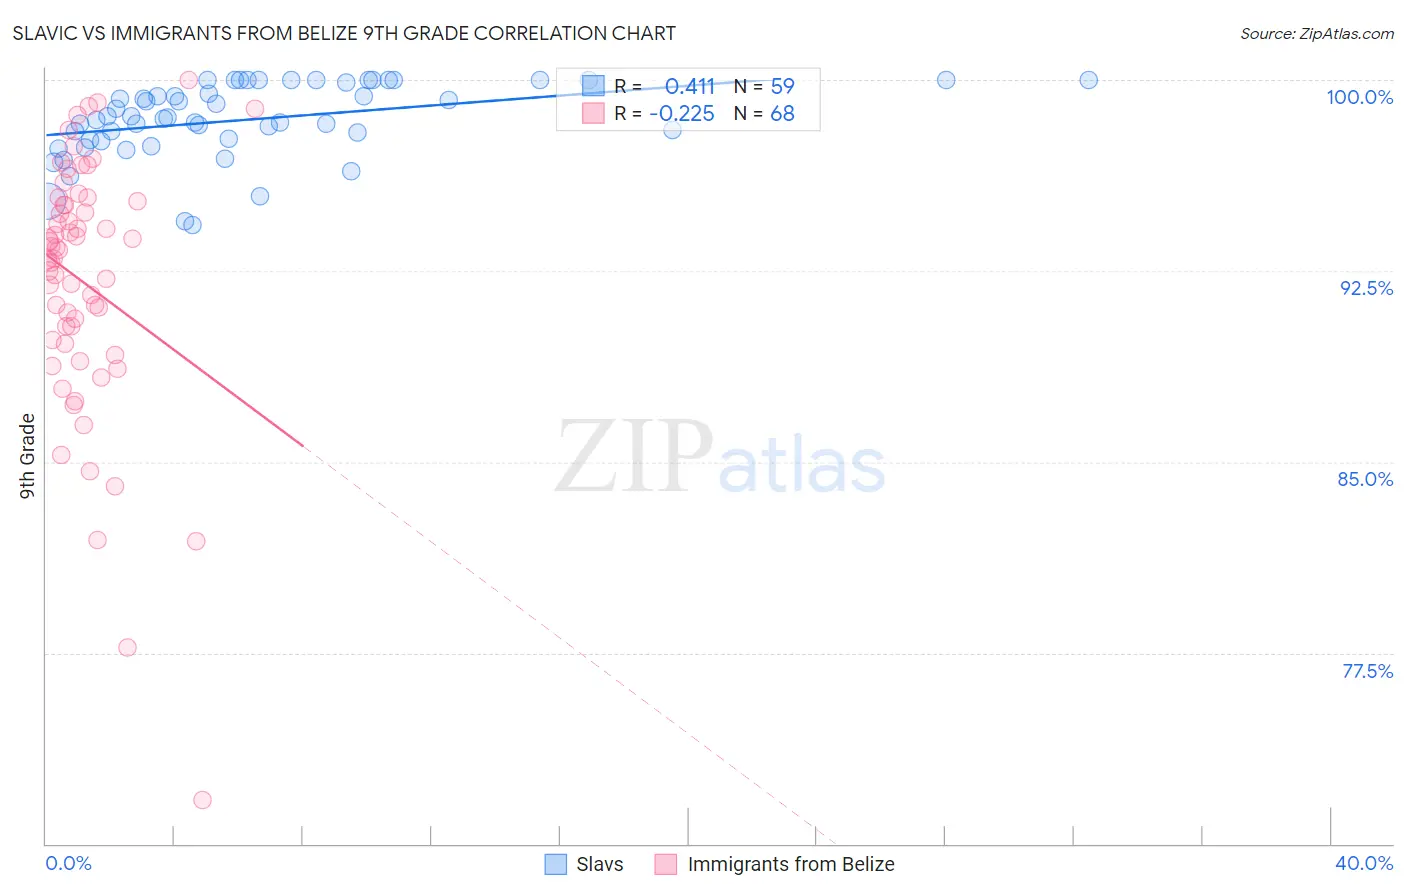
Slavic vs Immigrants from Belize 9th Grade Correlation Chart

The statistical analysis conducted on geographies consisting of 270,868,354 people shows a moderate positive correlation between the proportion of Slavs and percentage of population with at least 9th grade education in the United States with a correlation coefficient (R) of 0.411 and weighted average of 96.1%. Similarly, the statistical analysis conducted on geographies consisting of 130,181,087 people shows a weak negative correlation between the proportion of Immigrants from Belize and percentage of population with at least 9th grade education in the United States with a correlation coefficient (R) of -0.225 and weighted average of 91.8%, a difference of 4.7%.
Slavic vs Immigrants from Belize 9th Grade

9th Grade Correlation Summary

MeasurementSlavicImmigrants from Belize
Minimum94.3%71.7%
Maximum100.0%100.0%
Range5.7%28.3%
Mean98.5%92.0%
Median98.5%93.2%
Interquartile 25% (IQ1)97.6%89.7%
Interquartile 75% (IQ3)100.0%95.2%
Interquartile Range (IQR)2.4%5.5%
Standard Deviation (Sample)1.5%5.1%
Standard Deviation (Population)1.4%5.0%

Similar Demographics by 9th Grade

Demographics Similar to Slavs by 9th Grade

In terms of 9th grade, the demographic groups most similar to Slavs are Czechoslovakian (96.1%, a difference of 0.010%), Chippewa (96.1%, a difference of 0.010%), Ottawa (96.1%, a difference of 0.020%), Iranian (96.1%, a difference of 0.020%), and Estonian (96.1%, a difference of 0.040%).
DemographicsRating | Rank9th Grade
Luxembourgers
100.0
/100
|
#33
Exceptional
96.3%
Hungarians
100.0
/100
|
#34
Exceptional
96.2%
Bulgarians
99.9
/100
|
#35
Exceptional
96.2%
Northern Europeans
99.9
/100
|
#36
Exceptional
96.2%
Estonians
99.9
/100
|
#37
Exceptional
96.1%
Immigrants | Scotland
99.9
/100
|
#38
Exceptional
96.1%
Ottawa
99.9
/100
|
#39
Exceptional
96.1%
Slavs
99.9
/100
|
#40
Exceptional
96.1%
Czechoslovakians
99.9
/100
|
#41
Exceptional
96.1%
Chippewa
99.9
/100
|
#42
Exceptional
96.1%
Iranians
99.9
/100
|
#43
Exceptional
96.1%
Alaska Natives
99.9
/100
|
#44
Exceptional
96.1%
Crow
99.9
/100
|
#45
Exceptional
96.1%
Immigrants | India
99.9
/100
|
#46
Exceptional
96.1%
Russians
99.9
/100
|
#47
Exceptional
96.0%

Demographics Similar to Immigrants from Belize by 9th Grade

In terms of 9th grade, the demographic groups most similar to Immigrants from Belize are Belizean (91.8%, a difference of 0.060%), Puerto Rican (91.8%, a difference of 0.060%), Immigrants from Ecuador (91.8%, a difference of 0.090%), Nicaraguan (91.9%, a difference of 0.16%), and Ecuadorian (91.9%, a difference of 0.20%).
DemographicsRating | Rank9th Grade
Immigrants | Cuba
0.0
/100
|
#317
Tragic
92.2%
Nepalese
0.0
/100
|
#318
Tragic
92.0%
Ecuadorians
0.0
/100
|
#319
Tragic
91.9%
Nicaraguans
0.0
/100
|
#320
Tragic
91.9%
Immigrants | Ecuador
0.0
/100
|
#321
Tragic
91.8%
Belizeans
0.0
/100
|
#322
Tragic
91.8%
Puerto Ricans
0.0
/100
|
#323
Tragic
91.8%
Immigrants | Belize
0.0
/100
|
#324
Tragic
91.8%
Central American Indians
0.0
/100
|
#325
Tragic
91.5%
Immigrants | Armenia
0.0
/100
|
#326
Tragic
91.4%
Immigrants | Nicaragua
0.0
/100
|
#327
Tragic
91.3%
Dominicans
0.0
/100
|
#328
Tragic
91.1%
Hondurans
0.0
/100
|
#329
Tragic
91.0%
Immigrants | Cabo Verde
0.0
/100
|
#330
Tragic
90.9%
Mexican American Indians
0.0
/100
|
#331
Tragic
90.9%