Liberian vs Immigrants from Belize 9th Grade
COMPARE
Liberian
Immigrants from Belize
9th Grade
9th Grade Comparison
Liberians
Immigrants from Belize
94.8%
9TH GRADE
37.4/ 100
METRIC RATING
185th/ 347
METRIC RANK
91.8%
9TH GRADE
0.0/ 100
METRIC RATING
324th/ 347
METRIC RANK
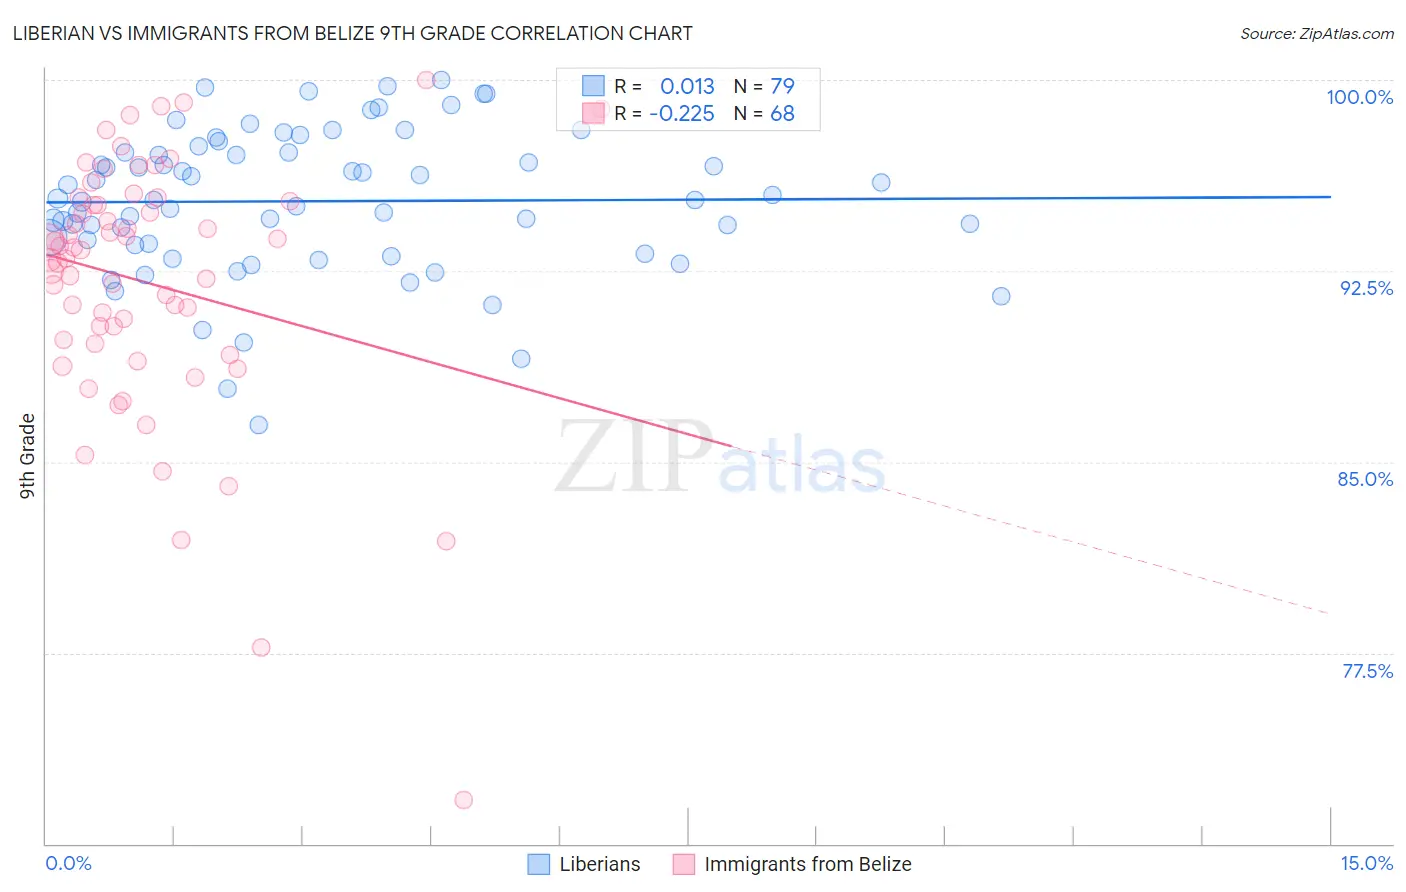
Liberian vs Immigrants from Belize 9th Grade Correlation Chart
The statistical analysis conducted on geographies consisting of 118,101,800 people shows no correlation between the proportion of Liberians and percentage of population with at least 9th grade education in the United States with a correlation coefficient (R) of 0.013 and weighted average of 94.8%. Similarly, the statistical analysis conducted on geographies consisting of 130,181,087 people shows a weak negative correlation between the proportion of Immigrants from Belize and percentage of population with at least 9th grade education in the United States with a correlation coefficient (R) of -0.225 and weighted average of 91.8%, a difference of 3.3%.
9th Grade Correlation Summary
| Measurement | Liberian | Immigrants from Belize |
| Minimum | 86.4% | 71.7% |
| Maximum | 100.0% | 100.0% |
| Range | 13.6% | 28.3% |
| Mean | 95.2% | 92.0% |
| Median | 95.3% | 93.2% |
| Interquartile 25% (IQ1) | 93.5% | 89.7% |
| Interquartile 75% (IQ3) | 97.2% | 95.2% |
| Interquartile Range (IQR) | 3.7% | 5.5% |
| Standard Deviation (Sample) | 2.8% | 5.1% |
| Standard Deviation (Population) | 2.8% | 5.0% |
Similar Demographics by 9th Grade
Demographics Similar to Liberians by 9th Grade
In terms of 9th grade, the demographic groups most similar to Liberians are Argentinean (94.8%, a difference of 0.0%), Hopi (94.8%, a difference of 0.0%), Immigrants from Nepal (94.8%, a difference of 0.020%), Guamanian/Chamorro (94.8%, a difference of 0.020%), and Immigrants from Albania (94.8%, a difference of 0.020%).
| Demographics | Rating | Rank | 9th Grade |
| Immigrants | Poland | 46.7 /100 | #178 | Average 94.9% |
| Immigrants | Venezuela | 46.5 /100 | #179 | Average 94.9% |
| Immigrants | Uganda | 43.1 /100 | #180 | Average 94.8% |
| Sierra Leoneans | 42.7 /100 | #181 | Average 94.8% |
| Seminole | 42.5 /100 | #182 | Average 94.8% |
| Immigrants | Nepal | 39.7 /100 | #183 | Fair 94.8% |
| Argentineans | 37.6 /100 | #184 | Fair 94.8% |
| Liberians | 37.4 /100 | #185 | Fair 94.8% |
| Hopi | 37.1 /100 | #186 | Fair 94.8% |
| Guamanians/Chamorros | 35.5 /100 | #187 | Fair 94.8% |
| Immigrants | Albania | 34.5 /100 | #188 | Fair 94.8% |
| Immigrants | Argentina | 34.4 /100 | #189 | Fair 94.8% |
| Sudanese | 32.7 /100 | #190 | Fair 94.7% |
| Assyrians/Chaldeans/Syriacs | 32.0 /100 | #191 | Fair 94.7% |
| Immigrants | Northern Africa | 30.7 /100 | #192 | Fair 94.7% |
Demographics Similar to Immigrants from Belize by 9th Grade
In terms of 9th grade, the demographic groups most similar to Immigrants from Belize are Belizean (91.8%, a difference of 0.060%), Puerto Rican (91.8%, a difference of 0.060%), Immigrants from Ecuador (91.8%, a difference of 0.090%), Nicaraguan (91.9%, a difference of 0.16%), and Ecuadorian (91.9%, a difference of 0.20%).
| Demographics | Rating | Rank | 9th Grade |
| Immigrants | Cuba | 0.0 /100 | #317 | Tragic 92.2% |
| Nepalese | 0.0 /100 | #318 | Tragic 92.0% |
| Ecuadorians | 0.0 /100 | #319 | Tragic 91.9% |
| Nicaraguans | 0.0 /100 | #320 | Tragic 91.9% |
| Immigrants | Ecuador | 0.0 /100 | #321 | Tragic 91.8% |
| Belizeans | 0.0 /100 | #322 | Tragic 91.8% |
| Puerto Ricans | 0.0 /100 | #323 | Tragic 91.8% |
| Immigrants | Belize | 0.0 /100 | #324 | Tragic 91.8% |
| Central American Indians | 0.0 /100 | #325 | Tragic 91.5% |
| Immigrants | Armenia | 0.0 /100 | #326 | Tragic 91.4% |
| Immigrants | Nicaragua | 0.0 /100 | #327 | Tragic 91.3% |
| Dominicans | 0.0 /100 | #328 | Tragic 91.1% |
| Hondurans | 0.0 /100 | #329 | Tragic 91.0% |
| Immigrants | Cabo Verde | 0.0 /100 | #330 | Tragic 90.9% |
| Mexican American Indians | 0.0 /100 | #331 | Tragic 90.9% |