Slavic vs Argentinean 9th Grade
COMPARE
Slavic
Argentinean
9th Grade
9th Grade Comparison
Slavs
Argentineans
96.1%
9TH GRADE
99.9/ 100
METRIC RATING
40th/ 347
METRIC RANK
94.8%
9TH GRADE
37.6/ 100
METRIC RATING
184th/ 347
METRIC RANK
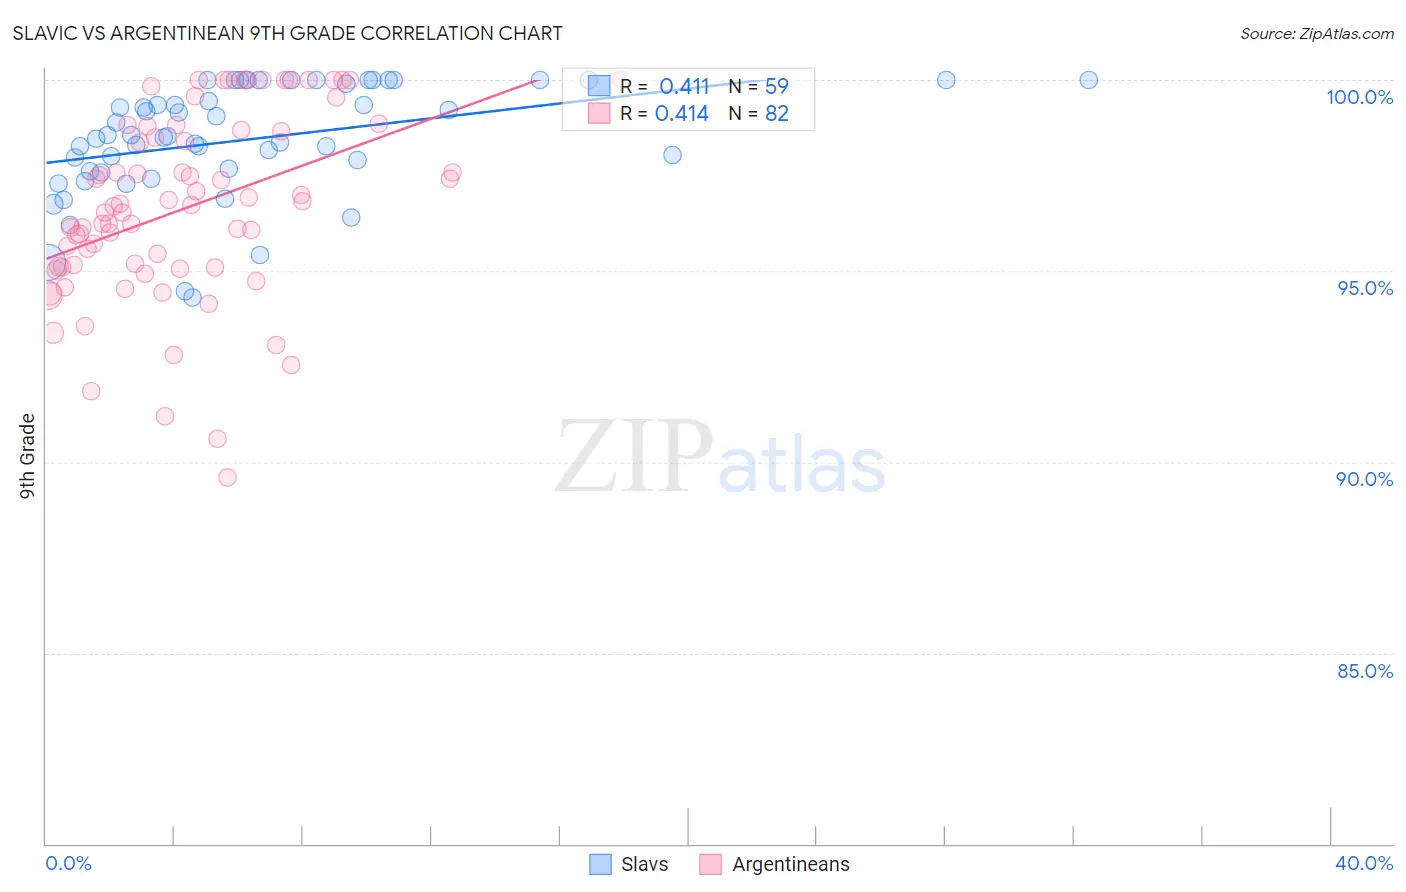
Slavic vs Argentinean 9th Grade Correlation Chart
The statistical analysis conducted on geographies consisting of 270,868,354 people shows a moderate positive correlation between the proportion of Slavs and percentage of population with at least 9th grade education in the United States with a correlation coefficient (R) of 0.411 and weighted average of 96.1%. Similarly, the statistical analysis conducted on geographies consisting of 297,143,432 people shows a moderate positive correlation between the proportion of Argentineans and percentage of population with at least 9th grade education in the United States with a correlation coefficient (R) of 0.414 and weighted average of 94.8%, a difference of 1.4%.
9th Grade Correlation Summary
| Measurement | Slavic | Argentinean |
| Minimum | 94.3% | 89.6% |
| Maximum | 100.0% | 100.0% |
| Range | 5.7% | 10.4% |
| Mean | 98.5% | 96.7% |
| Median | 98.5% | 96.7% |
| Interquartile 25% (IQ1) | 97.6% | 95.1% |
| Interquartile 75% (IQ3) | 100.0% | 98.7% |
| Interquartile Range (IQR) | 2.4% | 3.6% |
| Standard Deviation (Sample) | 1.5% | 2.4% |
| Standard Deviation (Population) | 1.4% | 2.4% |
Similar Demographics by 9th Grade
Demographics Similar to Slavs by 9th Grade
In terms of 9th grade, the demographic groups most similar to Slavs are Czechoslovakian (96.1%, a difference of 0.010%), Chippewa (96.1%, a difference of 0.010%), Ottawa (96.1%, a difference of 0.020%), Iranian (96.1%, a difference of 0.020%), and Estonian (96.1%, a difference of 0.040%).
| Demographics | Rating | Rank | 9th Grade |
| Luxembourgers | 100.0 /100 | #33 | Exceptional 96.3% |
| Hungarians | 100.0 /100 | #34 | Exceptional 96.2% |
| Bulgarians | 99.9 /100 | #35 | Exceptional 96.2% |
| Northern Europeans | 99.9 /100 | #36 | Exceptional 96.2% |
| Estonians | 99.9 /100 | #37 | Exceptional 96.1% |
| Immigrants | Scotland | 99.9 /100 | #38 | Exceptional 96.1% |
| Ottawa | 99.9 /100 | #39 | Exceptional 96.1% |
| Slavs | 99.9 /100 | #40 | Exceptional 96.1% |
| Czechoslovakians | 99.9 /100 | #41 | Exceptional 96.1% |
| Chippewa | 99.9 /100 | #42 | Exceptional 96.1% |
| Iranians | 99.9 /100 | #43 | Exceptional 96.1% |
| Alaska Natives | 99.9 /100 | #44 | Exceptional 96.1% |
| Crow | 99.9 /100 | #45 | Exceptional 96.1% |
| Immigrants | India | 99.9 /100 | #46 | Exceptional 96.1% |
| Russians | 99.9 /100 | #47 | Exceptional 96.0% |
Demographics Similar to Argentineans by 9th Grade
In terms of 9th grade, the demographic groups most similar to Argentineans are Liberian (94.8%, a difference of 0.0%), Hopi (94.8%, a difference of 0.0%), Immigrants from Nepal (94.8%, a difference of 0.020%), Guamanian/Chamorro (94.8%, a difference of 0.020%), and Immigrants from Albania (94.8%, a difference of 0.020%).
| Demographics | Rating | Rank | 9th Grade |
| Immigrants | Iraq | 47.8 /100 | #177 | Average 94.9% |
| Immigrants | Poland | 46.7 /100 | #178 | Average 94.9% |
| Immigrants | Venezuela | 46.5 /100 | #179 | Average 94.9% |
| Immigrants | Uganda | 43.1 /100 | #180 | Average 94.8% |
| Sierra Leoneans | 42.7 /100 | #181 | Average 94.8% |
| Seminole | 42.5 /100 | #182 | Average 94.8% |
| Immigrants | Nepal | 39.7 /100 | #183 | Fair 94.8% |
| Argentineans | 37.6 /100 | #184 | Fair 94.8% |
| Liberians | 37.4 /100 | #185 | Fair 94.8% |
| Hopi | 37.1 /100 | #186 | Fair 94.8% |
| Guamanians/Chamorros | 35.5 /100 | #187 | Fair 94.8% |
| Immigrants | Albania | 34.5 /100 | #188 | Fair 94.8% |
| Immigrants | Argentina | 34.4 /100 | #189 | Fair 94.8% |
| Sudanese | 32.7 /100 | #190 | Fair 94.7% |
| Assyrians/Chaldeans/Syriacs | 32.0 /100 | #191 | Fair 94.7% |