Slavic vs Cape Verdean 9th Grade
COMPARE
Slavic
Cape Verdean
9th Grade
9th Grade Comparison
Slavs
Cape Verdeans
96.1%
9TH GRADE
99.9/ 100
METRIC RATING
40th/ 347
METRIC RANK
92.2%
9TH GRADE
0.0/ 100
METRIC RATING
316th/ 347
METRIC RANK
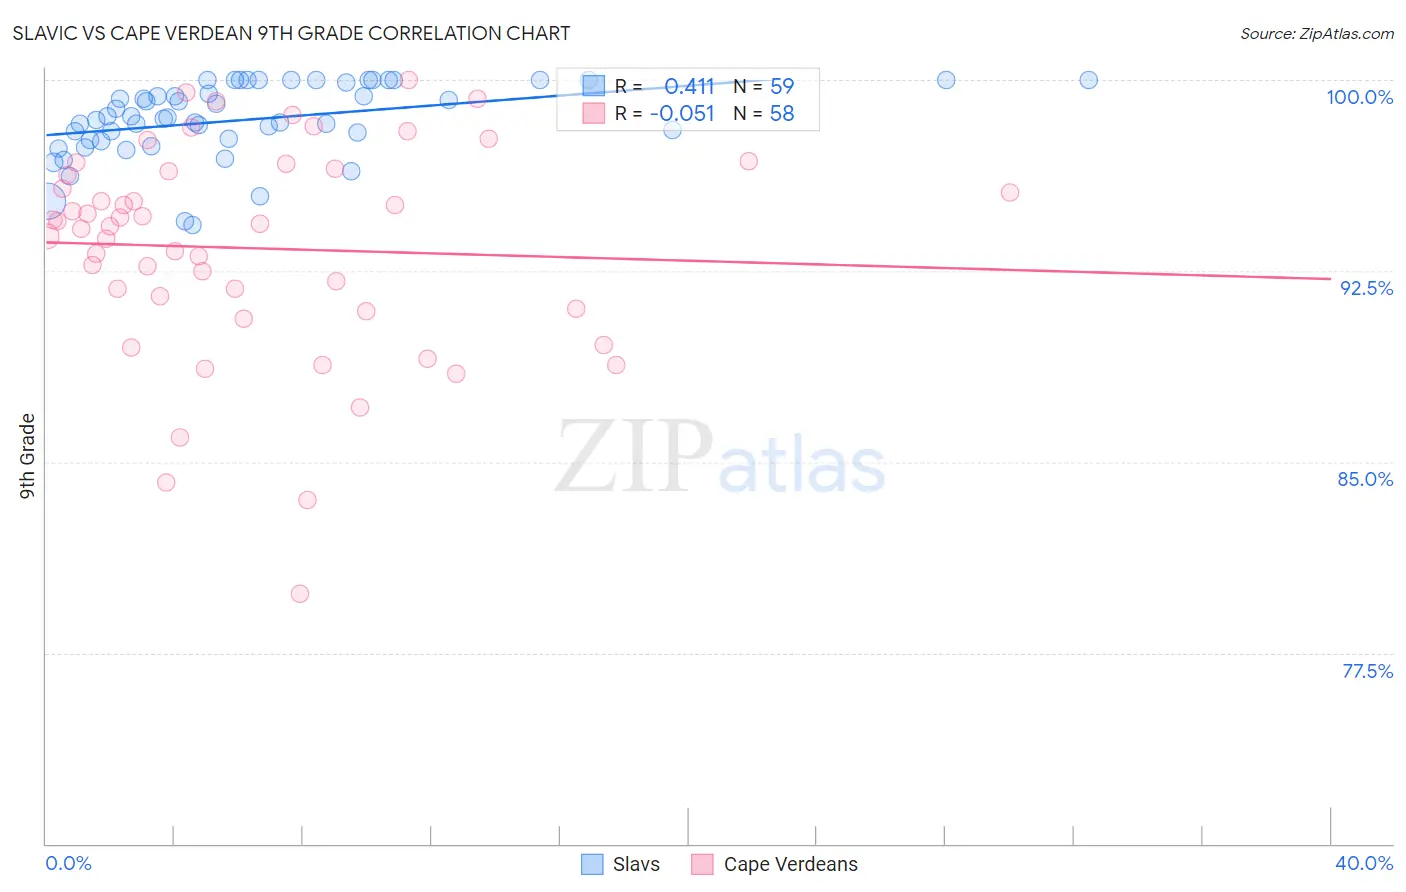
Slavic vs Cape Verdean 9th Grade Correlation Chart
The statistical analysis conducted on geographies consisting of 270,868,354 people shows a moderate positive correlation between the proportion of Slavs and percentage of population with at least 9th grade education in the United States with a correlation coefficient (R) of 0.411 and weighted average of 96.1%. Similarly, the statistical analysis conducted on geographies consisting of 107,537,955 people shows a slight negative correlation between the proportion of Cape Verdeans and percentage of population with at least 9th grade education in the United States with a correlation coefficient (R) of -0.051 and weighted average of 92.2%, a difference of 4.2%.
9th Grade Correlation Summary
| Measurement | Slavic | Cape Verdean |
| Minimum | 94.3% | 79.8% |
| Maximum | 100.0% | 100.0% |
| Range | 5.7% | 20.2% |
| Mean | 98.5% | 93.4% |
| Median | 98.5% | 94.3% |
| Interquartile 25% (IQ1) | 97.6% | 91.0% |
| Interquartile 75% (IQ3) | 100.0% | 96.4% |
| Interquartile Range (IQR) | 2.4% | 5.4% |
| Standard Deviation (Sample) | 1.5% | 4.2% |
| Standard Deviation (Population) | 1.4% | 4.2% |
Similar Demographics by 9th Grade
Demographics Similar to Slavs by 9th Grade
In terms of 9th grade, the demographic groups most similar to Slavs are Czechoslovakian (96.1%, a difference of 0.010%), Chippewa (96.1%, a difference of 0.010%), Ottawa (96.1%, a difference of 0.020%), Iranian (96.1%, a difference of 0.020%), and Estonian (96.1%, a difference of 0.040%).
| Demographics | Rating | Rank | 9th Grade |
| Luxembourgers | 100.0 /100 | #33 | Exceptional 96.3% |
| Hungarians | 100.0 /100 | #34 | Exceptional 96.2% |
| Bulgarians | 99.9 /100 | #35 | Exceptional 96.2% |
| Northern Europeans | 99.9 /100 | #36 | Exceptional 96.2% |
| Estonians | 99.9 /100 | #37 | Exceptional 96.1% |
| Immigrants | Scotland | 99.9 /100 | #38 | Exceptional 96.1% |
| Ottawa | 99.9 /100 | #39 | Exceptional 96.1% |
| Slavs | 99.9 /100 | #40 | Exceptional 96.1% |
| Czechoslovakians | 99.9 /100 | #41 | Exceptional 96.1% |
| Chippewa | 99.9 /100 | #42 | Exceptional 96.1% |
| Iranians | 99.9 /100 | #43 | Exceptional 96.1% |
| Alaska Natives | 99.9 /100 | #44 | Exceptional 96.1% |
| Crow | 99.9 /100 | #45 | Exceptional 96.1% |
| Immigrants | India | 99.9 /100 | #46 | Exceptional 96.1% |
| Russians | 99.9 /100 | #47 | Exceptional 96.0% |
Demographics Similar to Cape Verdeans by 9th Grade
In terms of 9th grade, the demographic groups most similar to Cape Verdeans are Immigrants from Cuba (92.2%, a difference of 0.010%), Immigrants from Caribbean (92.2%, a difference of 0.040%), Immigrants from Portugal (92.2%, a difference of 0.050%), Vietnamese (92.3%, a difference of 0.090%), and Houma (92.3%, a difference of 0.11%).
| Demographics | Rating | Rank | 9th Grade |
| Immigrants | Bangladesh | 0.0 /100 | #309 | Tragic 92.4% |
| Immigrants | Cambodia | 0.0 /100 | #310 | Tragic 92.4% |
| Immigrants | Fiji | 0.0 /100 | #311 | Tragic 92.3% |
| Houma | 0.0 /100 | #312 | Tragic 92.3% |
| Vietnamese | 0.0 /100 | #313 | Tragic 92.3% |
| Immigrants | Portugal | 0.0 /100 | #314 | Tragic 92.2% |
| Immigrants | Caribbean | 0.0 /100 | #315 | Tragic 92.2% |
| Cape Verdeans | 0.0 /100 | #316 | Tragic 92.2% |
| Immigrants | Cuba | 0.0 /100 | #317 | Tragic 92.2% |
| Nepalese | 0.0 /100 | #318 | Tragic 92.0% |
| Ecuadorians | 0.0 /100 | #319 | Tragic 91.9% |
| Nicaraguans | 0.0 /100 | #320 | Tragic 91.9% |
| Immigrants | Ecuador | 0.0 /100 | #321 | Tragic 91.8% |
| Belizeans | 0.0 /100 | #322 | Tragic 91.8% |
| Puerto Ricans | 0.0 /100 | #323 | Tragic 91.8% |