Alsatian vs Immigrants from Belize 9th Grade
COMPARE
Alsatian
Immigrants from Belize
9th Grade
9th Grade Comparison
Alsatians
Immigrants from Belize
94.9%
9TH GRADE
58.6/ 100
METRIC RATING
170th/ 347
METRIC RANK
91.8%
9TH GRADE
0.0/ 100
METRIC RATING
324th/ 347
METRIC RANK
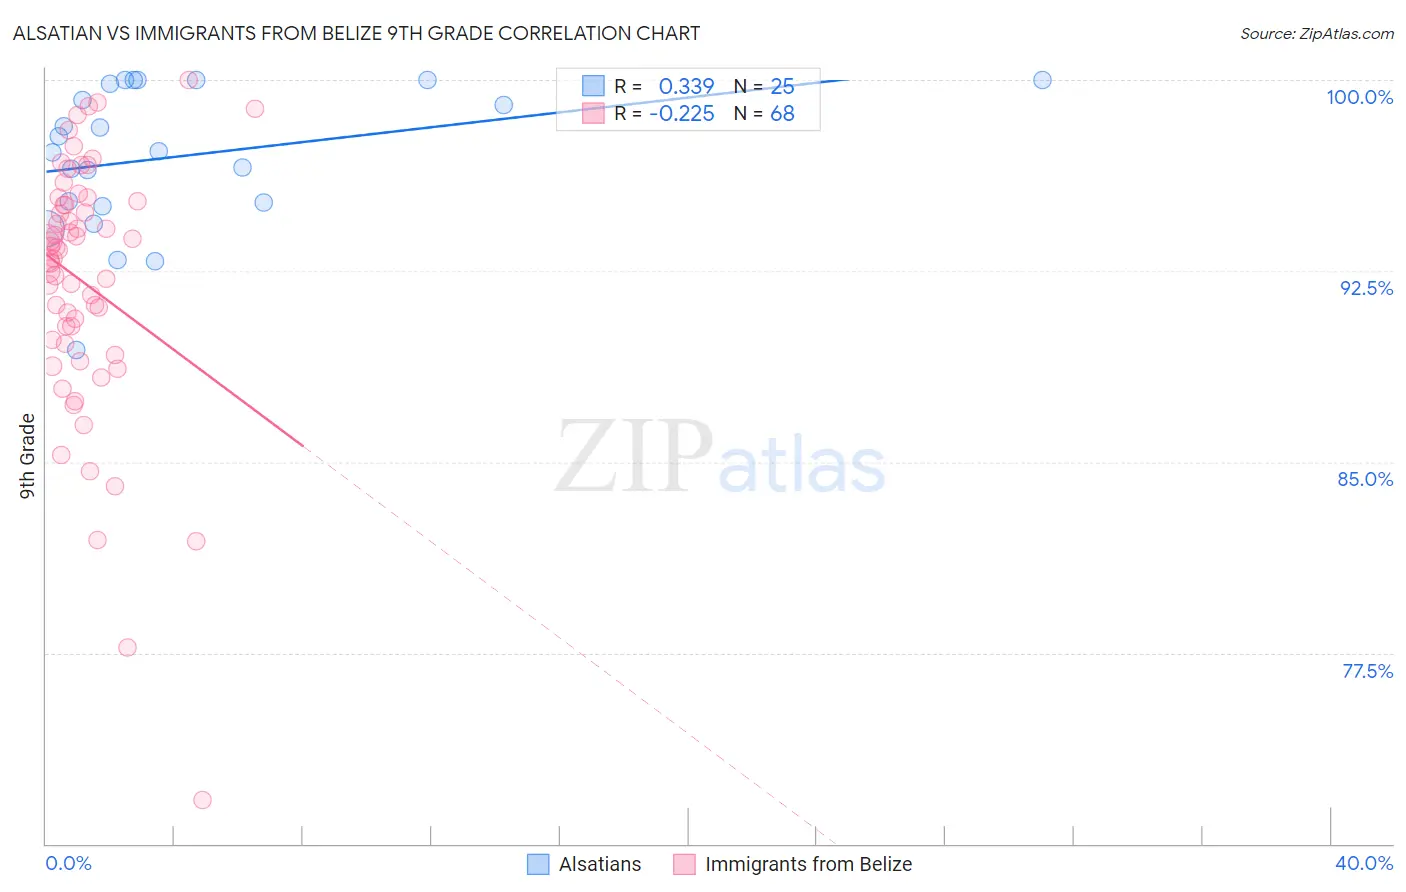
Alsatian vs Immigrants from Belize 9th Grade Correlation Chart
The statistical analysis conducted on geographies consisting of 82,682,365 people shows a mild positive correlation between the proportion of Alsatians and percentage of population with at least 9th grade education in the United States with a correlation coefficient (R) of 0.339 and weighted average of 94.9%. Similarly, the statistical analysis conducted on geographies consisting of 130,181,087 people shows a weak negative correlation between the proportion of Immigrants from Belize and percentage of population with at least 9th grade education in the United States with a correlation coefficient (R) of -0.225 and weighted average of 91.8%, a difference of 3.5%.
9th Grade Correlation Summary
| Measurement | Alsatian | Immigrants from Belize |
| Minimum | 89.4% | 71.7% |
| Maximum | 100.0% | 100.0% |
| Range | 10.6% | 28.3% |
| Mean | 97.0% | 92.0% |
| Median | 97.2% | 93.2% |
| Interquartile 25% (IQ1) | 95.1% | 89.7% |
| Interquartile 75% (IQ3) | 99.9% | 95.2% |
| Interquartile Range (IQR) | 4.8% | 5.5% |
| Standard Deviation (Sample) | 2.8% | 5.1% |
| Standard Deviation (Population) | 2.8% | 5.0% |
Similar Demographics by 9th Grade
Demographics Similar to Alsatians by 9th Grade
In terms of 9th grade, the demographic groups most similar to Alsatians are Colville (94.9%, a difference of 0.0%), Spaniard (94.9%, a difference of 0.010%), Immigrants from Brazil (95.0%, a difference of 0.020%), Chilean (95.0%, a difference of 0.020%), and Blackfeet (95.0%, a difference of 0.030%).
| Demographics | Rating | Rank | 9th Grade |
| Pakistanis | 64.1 /100 | #163 | Good 95.0% |
| Venezuelans | 63.6 /100 | #164 | Good 95.0% |
| Blackfeet | 62.6 /100 | #165 | Good 95.0% |
| Ute | 62.6 /100 | #166 | Good 95.0% |
| Immigrants | Brazil | 61.1 /100 | #167 | Good 95.0% |
| Chileans | 60.7 /100 | #168 | Good 95.0% |
| Spaniards | 59.6 /100 | #169 | Average 94.9% |
| Alsatians | 58.6 /100 | #170 | Average 94.9% |
| Colville | 58.5 /100 | #171 | Average 94.9% |
| Iraqis | 54.0 /100 | #172 | Average 94.9% |
| Cheyenne | 51.5 /100 | #173 | Average 94.9% |
| Immigrants | Egypt | 50.0 /100 | #174 | Average 94.9% |
| Brazilians | 49.8 /100 | #175 | Average 94.9% |
| Immigrants | Spain | 49.1 /100 | #176 | Average 94.9% |
| Immigrants | Iraq | 47.8 /100 | #177 | Average 94.9% |
Demographics Similar to Immigrants from Belize by 9th Grade
In terms of 9th grade, the demographic groups most similar to Immigrants from Belize are Belizean (91.8%, a difference of 0.060%), Puerto Rican (91.8%, a difference of 0.060%), Immigrants from Ecuador (91.8%, a difference of 0.090%), Nicaraguan (91.9%, a difference of 0.16%), and Ecuadorian (91.9%, a difference of 0.20%).
| Demographics | Rating | Rank | 9th Grade |
| Immigrants | Cuba | 0.0 /100 | #317 | Tragic 92.2% |
| Nepalese | 0.0 /100 | #318 | Tragic 92.0% |
| Ecuadorians | 0.0 /100 | #319 | Tragic 91.9% |
| Nicaraguans | 0.0 /100 | #320 | Tragic 91.9% |
| Immigrants | Ecuador | 0.0 /100 | #321 | Tragic 91.8% |
| Belizeans | 0.0 /100 | #322 | Tragic 91.8% |
| Puerto Ricans | 0.0 /100 | #323 | Tragic 91.8% |
| Immigrants | Belize | 0.0 /100 | #324 | Tragic 91.8% |
| Central American Indians | 0.0 /100 | #325 | Tragic 91.5% |
| Immigrants | Armenia | 0.0 /100 | #326 | Tragic 91.4% |
| Immigrants | Nicaragua | 0.0 /100 | #327 | Tragic 91.3% |
| Dominicans | 0.0 /100 | #328 | Tragic 91.1% |
| Hondurans | 0.0 /100 | #329 | Tragic 91.0% |
| Immigrants | Cabo Verde | 0.0 /100 | #330 | Tragic 90.9% |
| Mexican American Indians | 0.0 /100 | #331 | Tragic 90.9% |