Inupiat vs Cape Verdean 9th Grade

COMPARE

Inupiat
Race
Ancestry
AfghanAfricanAlaska NativeAlaskan AthabascanAlbanianAleutAlsatianAmericanApacheArabArapahoArgentineanArmenianAssyrian/Chaldean/SyriacAustralianAustrianBahamianBangladeshiBarbadianBasqueBelgianBelizeanBermudanBhutaneseBlackfeetBolivianBrazilianBritishBritish West IndianBulgarianBurmeseCajunCambodianCanadianCarpatho RusynCelticCentral AmericanCentral American IndianCherokeeCheyenneChickasawChileanChineseChippewaChoctawColombianColvilleComancheCosta RicanCreeCreekCroatianCrowCubanCypriotCzechCzechoslovakianDanishDelawareDominicanDutchDutch West IndianEastern EuropeanEcuadorianEgyptianEnglishEstonianEthiopianEuropeanFijianFilipinoFinnishFrenchFrench American IndianFrench CanadianGermanGerman RussianGhanaianGreekGuamanian/ChamorroGuatemalanGuyaneseHaitianHmongHonduranHopiHoumaHungarianIcelanderIndian (Asian)IndonesianInupiatIranianIraqiIrishIroquoisIsraeliItalianJamaicanJapaneseJordanianKenyanKiowaKoreanLaotianLatvianLebaneseLiberianLithuanianLumbeeLuxembourgerMacedonianMalaysianMalteseMarshalleseMenomineeMexicanMexican American IndianMongolianMoroccanNative HawaiianNavajoNepaleseNew ZealanderNicaraguanNigerianNorthern EuropeanNorwegianOkinawanOsageOttawaPaiutePakistaniPalestinianPanamanianParaguayanPennsylvania GermanPeruvianPimaPolishPortuguesePotawatomiPuebloPuerto RicanPuget Sound SalishRomanianRussianSalvadoranSamoanScandinavianScotch-IrishScottishSeminoleSenegaleseSerbianShoshoneSierra LeoneanSiouxSlavicSlovakSloveneSomaliSouth AfricanSouth AmericanSouth American IndianSoviet UnionSpaniardSpanishSpanish AmericanSpanish American IndianSri LankanSubsaharan AfricanSudaneseSwedishSwissSyrianTaiwaneseThaiTlingit-HaidaTohono O'OdhamTonganTrinidadian and TobagonianTsimshianTurkishU.S. Virgin IslanderUgandanUkrainianUruguayanUteVenezuelanVietnameseWelshWest IndianYakamaYaquiYugoslavianYumanYup'ikZimbabwean
Immigration
NonimmigrantsImmigrantsAfghanistanAfricaAlbaniaArgentinaArmeniaAsiaAustraliaAustriaBahamasBangladeshBarbadosBelarusBelgiumBelizeBoliviaBosnia and HerzegovinaBrazilBulgariaBurma/MyanmarCabo VerdeCambodiaCameroonCanadaCaribbeanCentral AmericaChileChinaColombiaCongoCosta RicaCroatiaCubaCzechoslovakiaDenmarkDominicaDominican RepublicEastern AfricaEastern AsiaEastern EuropeEcuadorEgyptEl SalvadorEnglandEritreaEthiopiaEuropeFijiFranceGermanyGhanaGreeceGrenadaGuatemalaGuyanaHaitiHondurasHong KongHungaryIndiaIndonesiaIranIraqIrelandIsraelItalyJamaicaJapanJordanKazakhstanKenyaKoreaKuwaitLaosLatin AmericaLatviaLebanonLiberiaLithuaniaMalaysiaMexicoMicronesiaMiddle AfricaMoldovaMoroccoNepalNetherlandsNicaraguaNigeriaNorth AmericaNorth MacedoniaNorthern AfricaNorthern EuropeNorwayOceaniaPakistanPanamaPeruPhilippinesPolandPortugalRomaniaRussiaSaudi ArabiaScotlandSenegalSerbiaSierra LeoneSingaporeSomaliaSouth AfricaSouth AmericaSouth Central AsiaSouth Eastern AsiaSouthern EuropeSpainSri LankaSt. Vincent and the GrenadinesSudanSwedenSwitzerlandSyriaTaiwanThailandTrinidad and TobagoTurkeyUgandaUkraineUruguayUzbekistanVenezuelaVietnamWest IndiesWestern AfricaWestern AsiaWestern EuropeYemenZaireZimbabweAzores
Cape Verdean
Race
Ancestry
AfghanAfricanAlaska NativeAlaskan AthabascanAlbanianAleutAlsatianAmericanApacheArabArapahoArgentineanArmenianAssyrian/Chaldean/SyriacAustralianAustrianBahamianBangladeshiBarbadianBasqueBelgianBelizeanBermudanBhutaneseBlackfeetBolivianBrazilianBritishBritish West IndianBulgarianBurmeseCajunCambodianCanadianCape VerdeanCarpatho RusynCelticCentral AmericanCentral American IndianCherokeeCheyenneChickasawChileanChineseChippewaChoctawColombianColvilleComancheCosta RicanCreeCreekCroatianCrowCubanCypriotCzechCzechoslovakianDanishDelawareDominicanDutchDutch West IndianEastern EuropeanEcuadorianEgyptianEnglishEstonianEthiopianEuropeanFijianFilipinoFinnishFrenchFrench American IndianFrench CanadianGermanGerman RussianGhanaianGreekGuamanian/ChamorroGuatemalanGuyaneseHaitianHmongHonduranHopiHoumaHungarianIcelanderIndian (Asian)IndonesianIranianIraqiIrishIroquoisIsraeliItalianJamaicanJapaneseJordanianKenyanKiowaKoreanLaotianLatvianLebaneseLiberianLithuanianLumbeeLuxembourgerMacedonianMalaysianMalteseMarshalleseMenomineeMexicanMexican American IndianMongolianMoroccanNative HawaiianNavajoNepaleseNew ZealanderNicaraguanNigerianNorthern EuropeanNorwegianOkinawanOsageOttawaPaiutePakistaniPalestinianPanamanianParaguayanPennsylvania GermanPeruvianPimaPolishPortuguesePotawatomiPuebloPuerto RicanPuget Sound SalishRomanianRussianSalvadoranSamoanScandinavianScotch-IrishScottishSeminoleSenegaleseSerbianShoshoneSierra LeoneanSiouxSlavicSlovakSloveneSomaliSouth AfricanSouth AmericanSouth American IndianSoviet UnionSpaniardSpanishSpanish AmericanSpanish American IndianSri LankanSubsaharan AfricanSudaneseSwedishSwissSyrianTaiwaneseThaiTlingit-HaidaTohono O'OdhamTonganTrinidadian and TobagonianTsimshianTurkishU.S. Virgin IslanderUgandanUkrainianUruguayanUteVenezuelanVietnameseWelshWest IndianYakamaYaquiYugoslavianYumanYup'ikZimbabwean
Immigration
NonimmigrantsImmigrantsAfghanistanAfricaAlbaniaArgentinaArmeniaAsiaAustraliaAustriaBahamasBangladeshBarbadosBelarusBelgiumBelizeBoliviaBosnia and HerzegovinaBrazilBulgariaBurma/MyanmarCabo VerdeCambodiaCameroonCanadaCaribbeanCentral AmericaChileChinaColombiaCongoCosta RicaCroatiaCubaCzechoslovakiaDenmarkDominicaDominican RepublicEastern AfricaEastern AsiaEastern EuropeEcuadorEgyptEl SalvadorEnglandEritreaEthiopiaEuropeFijiFranceGermanyGhanaGreeceGrenadaGuatemalaGuyanaHaitiHondurasHong KongHungaryIndiaIndonesiaIranIraqIrelandIsraelItalyJamaicaJapanJordanKazakhstanKenyaKoreaKuwaitLaosLatin AmericaLatviaLebanonLiberiaLithuaniaMalaysiaMexicoMicronesiaMiddle AfricaMoldovaMoroccoNepalNetherlandsNicaraguaNigeriaNorth AmericaNorth MacedoniaNorthern AfricaNorthern EuropeNorwayOceaniaPakistanPanamaPeruPhilippinesPolandPortugalRomaniaRussiaSaudi ArabiaScotlandSenegalSerbiaSierra LeoneSingaporeSomaliaSouth AfricaSouth AmericaSouth Central AsiaSouth Eastern AsiaSouthern EuropeSpainSri LankaSt. Vincent and the GrenadinesSudanSwedenSwitzerlandSyriaTaiwanThailandTrinidad and TobagoTurkeyUgandaUkraineUruguayUzbekistanVenezuelaVietnamWest IndiesWestern AfricaWestern AsiaWestern EuropeYemenZaireZimbabweAzores
9th Grade
Income
Poverty
Unemployment
Labor Participation
Family Structure
Vehicle Availability
Education Level
Disability

9th Grade Comparison

Inupiat

Cape Verdeans

Exceptional
Tragic
95.8%
9TH GRADE
99.5/ 100
METRIC RATING
75th/ 347
METRIC RANK
92.2%
9TH GRADE
0.0/ 100
METRIC RATING
316th/ 347
METRIC RANK

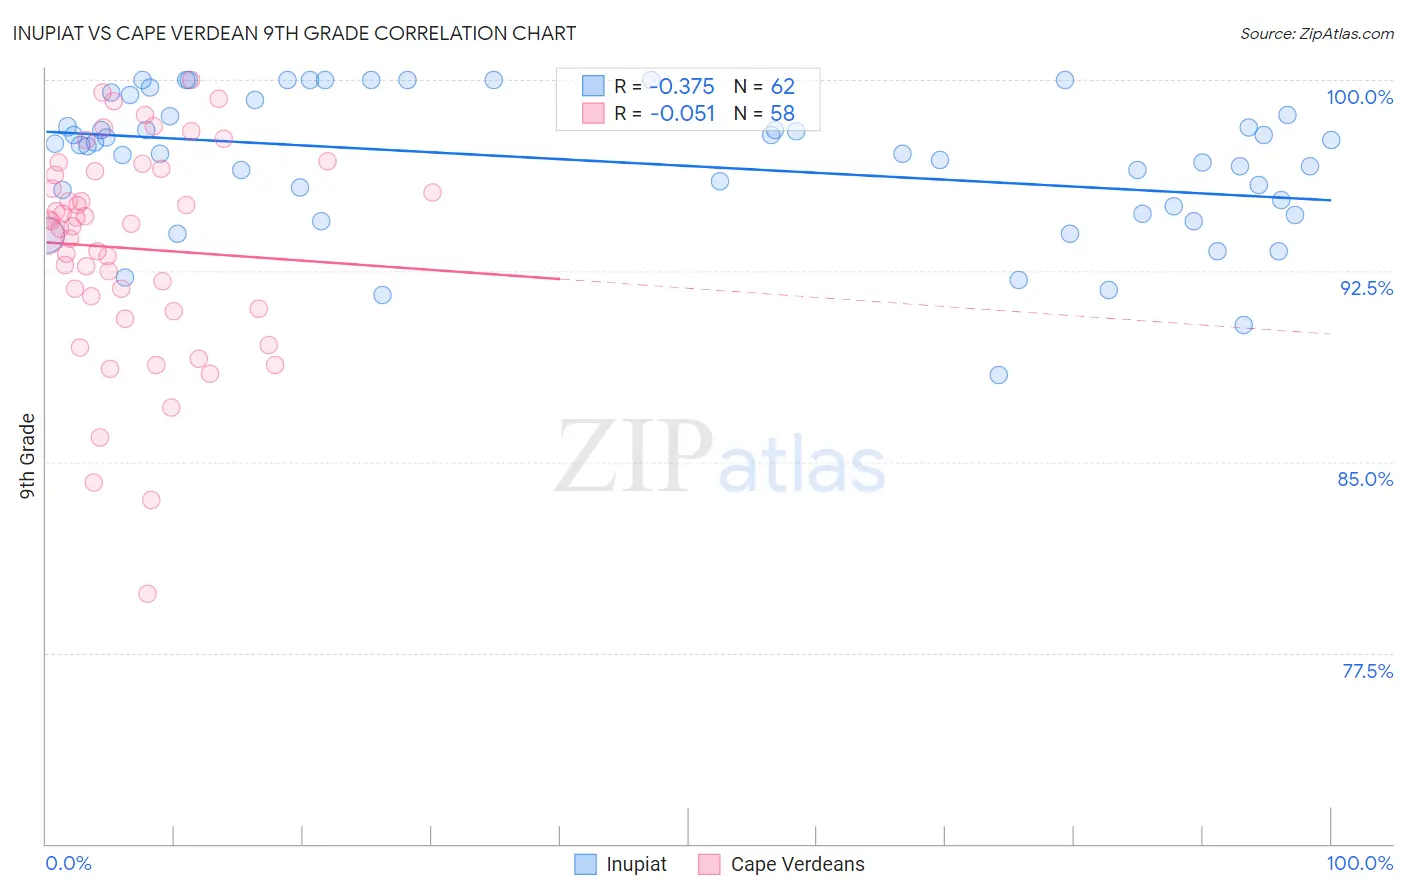
Inupiat vs Cape Verdean 9th Grade Correlation Chart

The statistical analysis conducted on geographies consisting of 96,349,180 people shows a mild negative correlation between the proportion of Inupiat and percentage of population with at least 9th grade education in the United States with a correlation coefficient (R) of -0.375 and weighted average of 95.8%. Similarly, the statistical analysis conducted on geographies consisting of 107,537,955 people shows a slight negative correlation between the proportion of Cape Verdeans and percentage of population with at least 9th grade education in the United States with a correlation coefficient (R) of -0.051 and weighted average of 92.2%, a difference of 3.9%.
Inupiat vs Cape Verdean 9th Grade

9th Grade Correlation Summary

MeasurementInupiatCape Verdean
Minimum88.4%79.8%
Maximum100.0%100.0%
Range11.6%20.2%
Mean96.8%93.4%
Median97.4%94.3%
Interquartile 25% (IQ1)95.0%91.0%
Interquartile 75% (IQ3)98.6%96.4%
Interquartile Range (IQR)3.6%5.4%
Standard Deviation (Sample)2.7%4.2%
Standard Deviation (Population)2.7%4.2%

Similar Demographics by 9th Grade

Demographics Similar to Inupiat by 9th Grade

In terms of 9th grade, the demographic groups most similar to Inupiat are Thai (95.8%, a difference of 0.010%), Immigrants from Sweden (95.8%, a difference of 0.010%), White/Caucasian (95.8%, a difference of 0.010%), Immigrants from South Africa (95.8%, a difference of 0.010%), and Immigrants from Belgium (95.8%, a difference of 0.020%).
DemographicsRating | Rank9th Grade
Immigrants | Ireland
99.6
/100
|
#68
Exceptional
95.8%
Immigrants | Lithuania
99.6
/100
|
#69
Exceptional
95.8%
Immigrants | Australia
99.5
/100
|
#70
Exceptional
95.8%
Immigrants | Belgium
99.5
/100
|
#71
Exceptional
95.8%
Turks
99.5
/100
|
#72
Exceptional
95.8%
Immigrants | Singapore
99.5
/100
|
#73
Exceptional
95.8%
Thais
99.5
/100
|
#74
Exceptional
95.8%
Inupiat
99.5
/100
|
#75
Exceptional
95.8%
Immigrants | Sweden
99.5
/100
|
#76
Exceptional
95.8%
Whites/Caucasians
99.4
/100
|
#77
Exceptional
95.8%
Immigrants | South Africa
99.4
/100
|
#78
Exceptional
95.8%
Romanians
99.3
/100
|
#79
Exceptional
95.7%
Bhutanese
99.3
/100
|
#80
Exceptional
95.7%
Arapaho
99.3
/100
|
#81
Exceptional
95.7%
Puget Sound Salish
99.2
/100
|
#82
Exceptional
95.7%

Demographics Similar to Cape Verdeans by 9th Grade

In terms of 9th grade, the demographic groups most similar to Cape Verdeans are Immigrants from Cuba (92.2%, a difference of 0.010%), Immigrants from Caribbean (92.2%, a difference of 0.040%), Immigrants from Portugal (92.2%, a difference of 0.050%), Vietnamese (92.3%, a difference of 0.090%), and Houma (92.3%, a difference of 0.11%).
DemographicsRating | Rank9th Grade
Immigrants | Bangladesh
0.0
/100
|
#309
Tragic
92.4%
Immigrants | Cambodia
0.0
/100
|
#310
Tragic
92.4%
Immigrants | Fiji
0.0
/100
|
#311
Tragic
92.3%
Houma
0.0
/100
|
#312
Tragic
92.3%
Vietnamese
0.0
/100
|
#313
Tragic
92.3%
Immigrants | Portugal
0.0
/100
|
#314
Tragic
92.2%
Immigrants | Caribbean
0.0
/100
|
#315
Tragic
92.2%
Cape Verdeans
0.0
/100
|
#316
Tragic
92.2%
Immigrants | Cuba
0.0
/100
|
#317
Tragic
92.2%
Nepalese
0.0
/100
|
#318
Tragic
92.0%
Ecuadorians
0.0
/100
|
#319
Tragic
91.9%
Nicaraguans
0.0
/100
|
#320
Tragic
91.9%
Immigrants | Ecuador
0.0
/100
|
#321
Tragic
91.8%
Belizeans
0.0
/100
|
#322
Tragic
91.8%
Puerto Ricans
0.0
/100
|
#323
Tragic
91.8%