Delaware vs Cape Verdean 9th Grade
COMPARE
Delaware
Cape Verdean
9th Grade
9th Grade Comparison
Delaware
Cape Verdeans
95.6%
9TH GRADE
98.4/ 100
METRIC RATING
97th/ 347
METRIC RANK
92.2%
9TH GRADE
0.0/ 100
METRIC RATING
316th/ 347
METRIC RANK
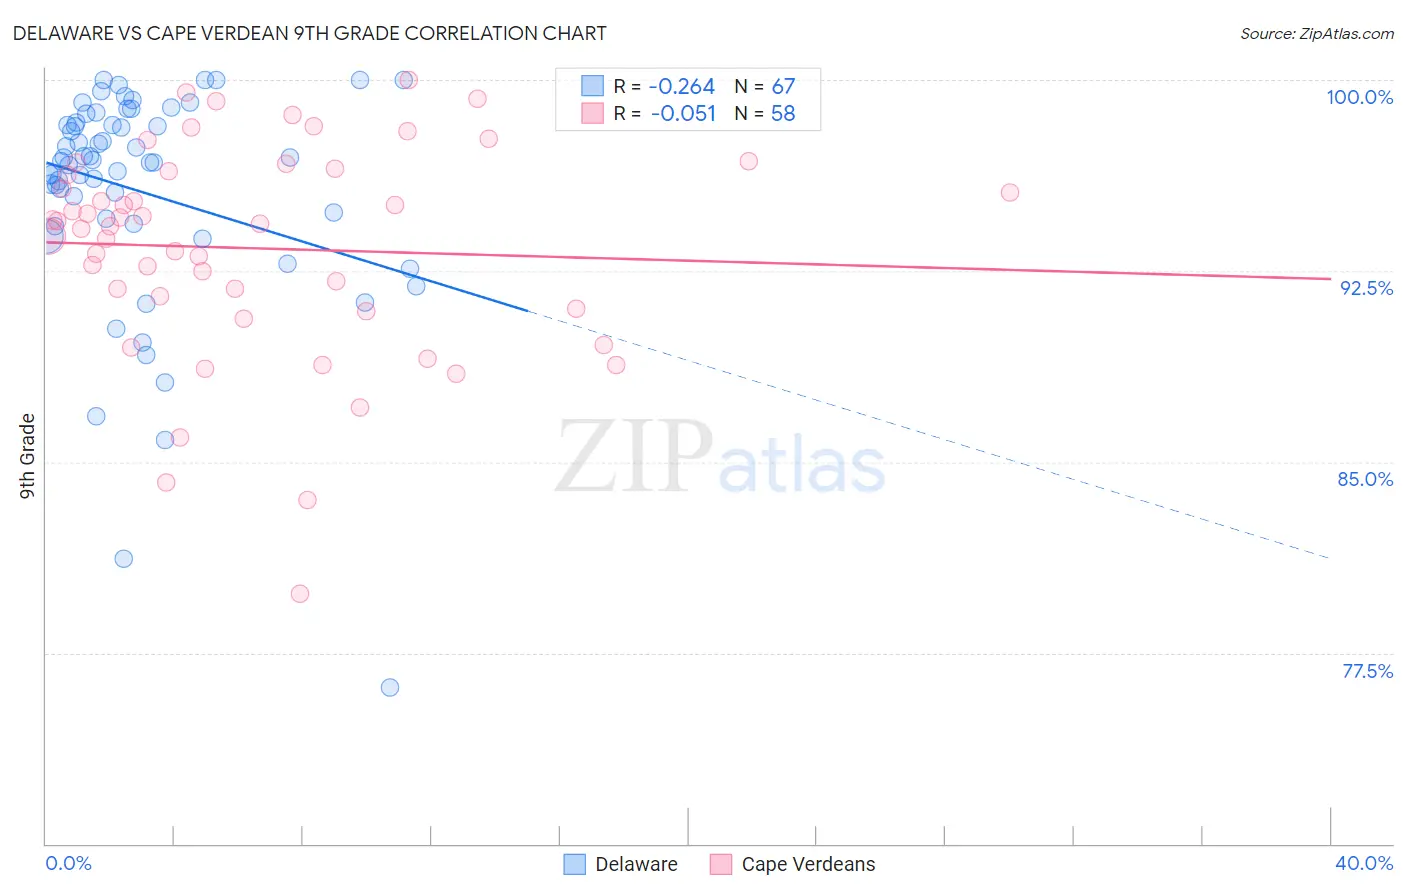
Delaware vs Cape Verdean 9th Grade Correlation Chart
The statistical analysis conducted on geographies consisting of 96,234,866 people shows a weak negative correlation between the proportion of Delaware and percentage of population with at least 9th grade education in the United States with a correlation coefficient (R) of -0.264 and weighted average of 95.6%. Similarly, the statistical analysis conducted on geographies consisting of 107,537,955 people shows a slight negative correlation between the proportion of Cape Verdeans and percentage of population with at least 9th grade education in the United States with a correlation coefficient (R) of -0.051 and weighted average of 92.2%, a difference of 3.7%.
9th Grade Correlation Summary
| Measurement | Delaware | Cape Verdean |
| Minimum | 76.1% | 79.8% |
| Maximum | 100.0% | 100.0% |
| Range | 23.9% | 20.2% |
| Mean | 95.6% | 93.4% |
| Median | 96.8% | 94.3% |
| Interquartile 25% (IQ1) | 94.3% | 91.0% |
| Interquartile 75% (IQ3) | 98.3% | 96.4% |
| Interquartile Range (IQR) | 4.0% | 5.4% |
| Standard Deviation (Sample) | 4.5% | 4.2% |
| Standard Deviation (Population) | 4.4% | 4.2% |
Similar Demographics by 9th Grade
Demographics Similar to Delaware by 9th Grade
In terms of 9th grade, the demographic groups most similar to Delaware are Filipino (95.6%, a difference of 0.0%), American (95.6%, a difference of 0.010%), Immigrants from Japan (95.6%, a difference of 0.010%), Menominee (95.6%, a difference of 0.010%), and Immigrants from Germany (95.6%, a difference of 0.030%).
| Demographics | Rating | Rank | 9th Grade |
| South Africans | 98.8 /100 | #90 | Exceptional 95.6% |
| Creek | 98.8 /100 | #91 | Exceptional 95.6% |
| Immigrants | Saudi Arabia | 98.8 /100 | #92 | Exceptional 95.6% |
| Immigrants | Germany | 98.7 /100 | #93 | Exceptional 95.6% |
| Immigrants | Latvia | 98.7 /100 | #94 | Exceptional 95.6% |
| Americans | 98.5 /100 | #95 | Exceptional 95.6% |
| Filipinos | 98.5 /100 | #96 | Exceptional 95.6% |
| Delaware | 98.4 /100 | #97 | Exceptional 95.6% |
| Immigrants | Japan | 98.4 /100 | #98 | Exceptional 95.6% |
| Menominee | 98.3 /100 | #99 | Exceptional 95.6% |
| Lebanese | 98.1 /100 | #100 | Exceptional 95.6% |
| Immigrants | Moldova | 97.9 /100 | #101 | Exceptional 95.5% |
| Immigrants | Switzerland | 97.7 /100 | #102 | Exceptional 95.5% |
| Potawatomi | 97.7 /100 | #103 | Exceptional 95.5% |
| Syrians | 97.4 /100 | #104 | Exceptional 95.5% |
Demographics Similar to Cape Verdeans by 9th Grade
In terms of 9th grade, the demographic groups most similar to Cape Verdeans are Immigrants from Cuba (92.2%, a difference of 0.010%), Immigrants from Caribbean (92.2%, a difference of 0.040%), Immigrants from Portugal (92.2%, a difference of 0.050%), Vietnamese (92.3%, a difference of 0.090%), and Houma (92.3%, a difference of 0.11%).
| Demographics | Rating | Rank | 9th Grade |
| Immigrants | Bangladesh | 0.0 /100 | #309 | Tragic 92.4% |
| Immigrants | Cambodia | 0.0 /100 | #310 | Tragic 92.4% |
| Immigrants | Fiji | 0.0 /100 | #311 | Tragic 92.3% |
| Houma | 0.0 /100 | #312 | Tragic 92.3% |
| Vietnamese | 0.0 /100 | #313 | Tragic 92.3% |
| Immigrants | Portugal | 0.0 /100 | #314 | Tragic 92.2% |
| Immigrants | Caribbean | 0.0 /100 | #315 | Tragic 92.2% |
| Cape Verdeans | 0.0 /100 | #316 | Tragic 92.2% |
| Immigrants | Cuba | 0.0 /100 | #317 | Tragic 92.2% |
| Nepalese | 0.0 /100 | #318 | Tragic 92.0% |
| Ecuadorians | 0.0 /100 | #319 | Tragic 91.9% |
| Nicaraguans | 0.0 /100 | #320 | Tragic 91.9% |
| Immigrants | Ecuador | 0.0 /100 | #321 | Tragic 91.8% |
| Belizeans | 0.0 /100 | #322 | Tragic 91.8% |
| Puerto Ricans | 0.0 /100 | #323 | Tragic 91.8% |