Immigrants from South America vs Cape Verdean 9th Grade
COMPARE
Immigrants from South America
Cape Verdean
9th Grade
9th Grade Comparison
Immigrants from South America
Cape Verdeans
93.8%
9TH GRADE
0.2/ 100
METRIC RATING
273rd/ 347
METRIC RANK
92.2%
9TH GRADE
0.0/ 100
METRIC RATING
316th/ 347
METRIC RANK
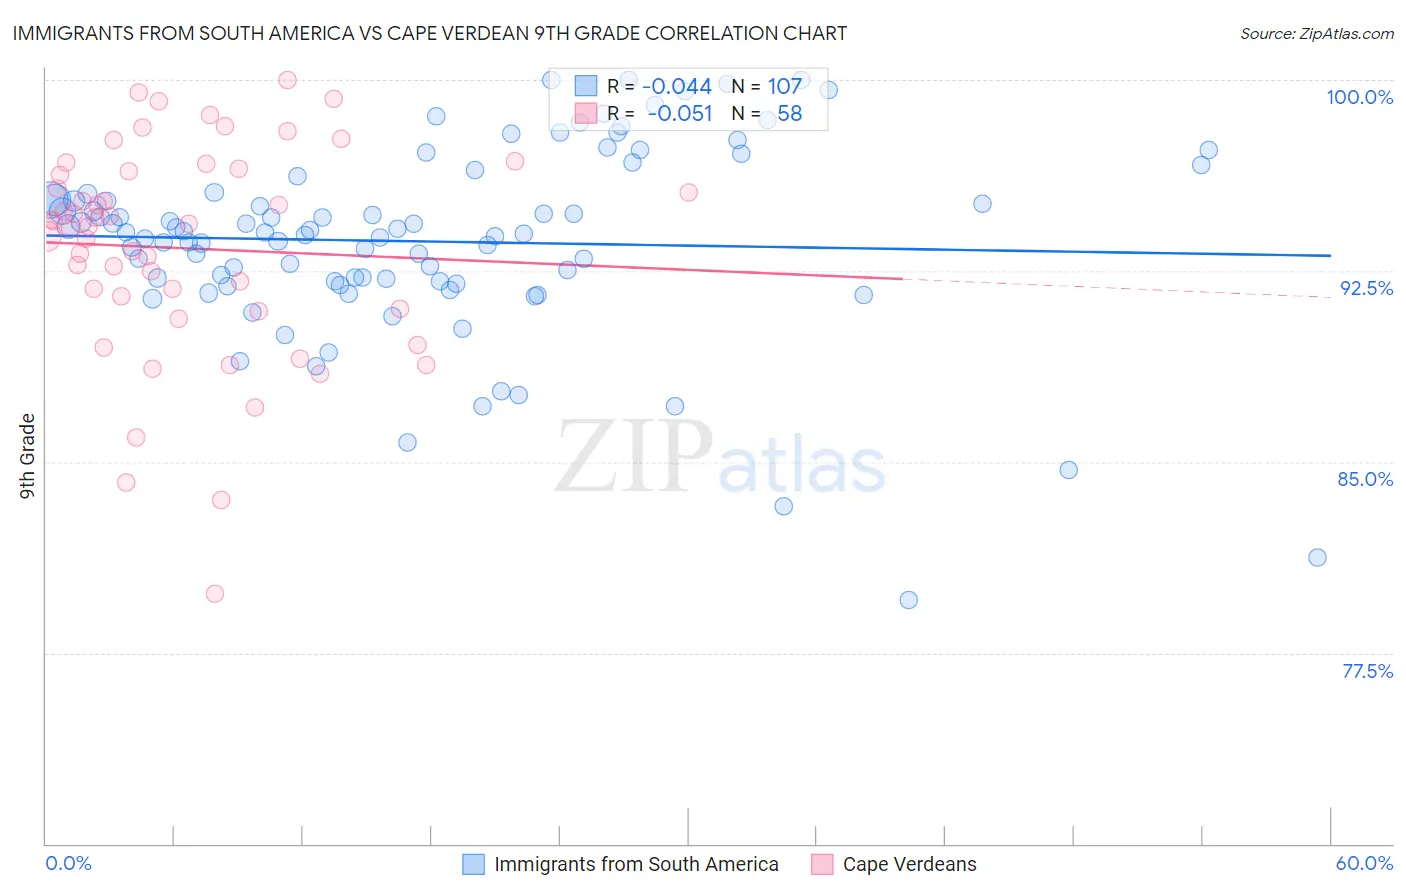
Immigrants from South America vs Cape Verdean 9th Grade Correlation Chart
The statistical analysis conducted on geographies consisting of 486,312,594 people shows no correlation between the proportion of Immigrants from South America and percentage of population with at least 9th grade education in the United States with a correlation coefficient (R) of -0.044 and weighted average of 93.8%. Similarly, the statistical analysis conducted on geographies consisting of 107,537,955 people shows a slight negative correlation between the proportion of Cape Verdeans and percentage of population with at least 9th grade education in the United States with a correlation coefficient (R) of -0.051 and weighted average of 92.2%, a difference of 1.7%.
9th Grade Correlation Summary
| Measurement | Immigrants from South America | Cape Verdean |
| Minimum | 79.6% | 79.8% |
| Maximum | 100.0% | 100.0% |
| Range | 20.4% | 20.2% |
| Mean | 93.7% | 93.4% |
| Median | 94.0% | 94.3% |
| Interquartile 25% (IQ1) | 92.1% | 91.0% |
| Interquartile 75% (IQ3) | 95.5% | 96.4% |
| Interquartile Range (IQR) | 3.4% | 5.4% |
| Standard Deviation (Sample) | 3.8% | 4.2% |
| Standard Deviation (Population) | 3.7% | 4.2% |
Similar Demographics by 9th Grade
Demographics Similar to Immigrants from South America by 9th Grade
In terms of 9th grade, the demographic groups most similar to Immigrants from South America are Peruvian (93.8%, a difference of 0.0%), Immigrants from Western Africa (93.8%, a difference of 0.010%), Immigrants from Colombia (93.8%, a difference of 0.010%), Immigrants from Ghana (93.8%, a difference of 0.020%), and West Indian (93.7%, a difference of 0.030%).
| Demographics | Rating | Rank | 9th Grade |
| Navajo | 0.3 /100 | #266 | Tragic 93.9% |
| Armenians | 0.3 /100 | #267 | Tragic 93.9% |
| Immigrants | Bolivia | 0.3 /100 | #268 | Tragic 93.9% |
| Immigrants | Uruguay | 0.2 /100 | #269 | Tragic 93.8% |
| Yuman | 0.2 /100 | #270 | Tragic 93.8% |
| Immigrants | Ghana | 0.2 /100 | #271 | Tragic 93.8% |
| Immigrants | Western Africa | 0.2 /100 | #272 | Tragic 93.8% |
| Immigrants | South America | 0.2 /100 | #273 | Tragic 93.8% |
| Peruvians | 0.2 /100 | #274 | Tragic 93.8% |
| Immigrants | Colombia | 0.2 /100 | #275 | Tragic 93.8% |
| West Indians | 0.2 /100 | #276 | Tragic 93.7% |
| Immigrants | Philippines | 0.1 /100 | #277 | Tragic 93.7% |
| Immigrants | Eritrea | 0.1 /100 | #278 | Tragic 93.7% |
| Trinidadians and Tobagonians | 0.1 /100 | #279 | Tragic 93.7% |
| Taiwanese | 0.1 /100 | #280 | Tragic 93.6% |
Demographics Similar to Cape Verdeans by 9th Grade
In terms of 9th grade, the demographic groups most similar to Cape Verdeans are Immigrants from Cuba (92.2%, a difference of 0.010%), Immigrants from Caribbean (92.2%, a difference of 0.040%), Immigrants from Portugal (92.2%, a difference of 0.050%), Vietnamese (92.3%, a difference of 0.090%), and Houma (92.3%, a difference of 0.11%).
| Demographics | Rating | Rank | 9th Grade |
| Immigrants | Bangladesh | 0.0 /100 | #309 | Tragic 92.4% |
| Immigrants | Cambodia | 0.0 /100 | #310 | Tragic 92.4% |
| Immigrants | Fiji | 0.0 /100 | #311 | Tragic 92.3% |
| Houma | 0.0 /100 | #312 | Tragic 92.3% |
| Vietnamese | 0.0 /100 | #313 | Tragic 92.3% |
| Immigrants | Portugal | 0.0 /100 | #314 | Tragic 92.2% |
| Immigrants | Caribbean | 0.0 /100 | #315 | Tragic 92.2% |
| Cape Verdeans | 0.0 /100 | #316 | Tragic 92.2% |
| Immigrants | Cuba | 0.0 /100 | #317 | Tragic 92.2% |
| Nepalese | 0.0 /100 | #318 | Tragic 92.0% |
| Ecuadorians | 0.0 /100 | #319 | Tragic 91.9% |
| Nicaraguans | 0.0 /100 | #320 | Tragic 91.9% |
| Immigrants | Ecuador | 0.0 /100 | #321 | Tragic 91.8% |
| Belizeans | 0.0 /100 | #322 | Tragic 91.8% |
| Puerto Ricans | 0.0 /100 | #323 | Tragic 91.8% |