Immigrants from Cuba vs Cape Verdean 9th Grade
COMPARE
Immigrants from Cuba
Cape Verdean
9th Grade
9th Grade Comparison
Immigrants from Cuba
Cape Verdeans
92.2%
9TH GRADE
0.0/ 100
METRIC RATING
317th/ 347
METRIC RANK
92.2%
9TH GRADE
0.0/ 100
METRIC RATING
316th/ 347
METRIC RANK
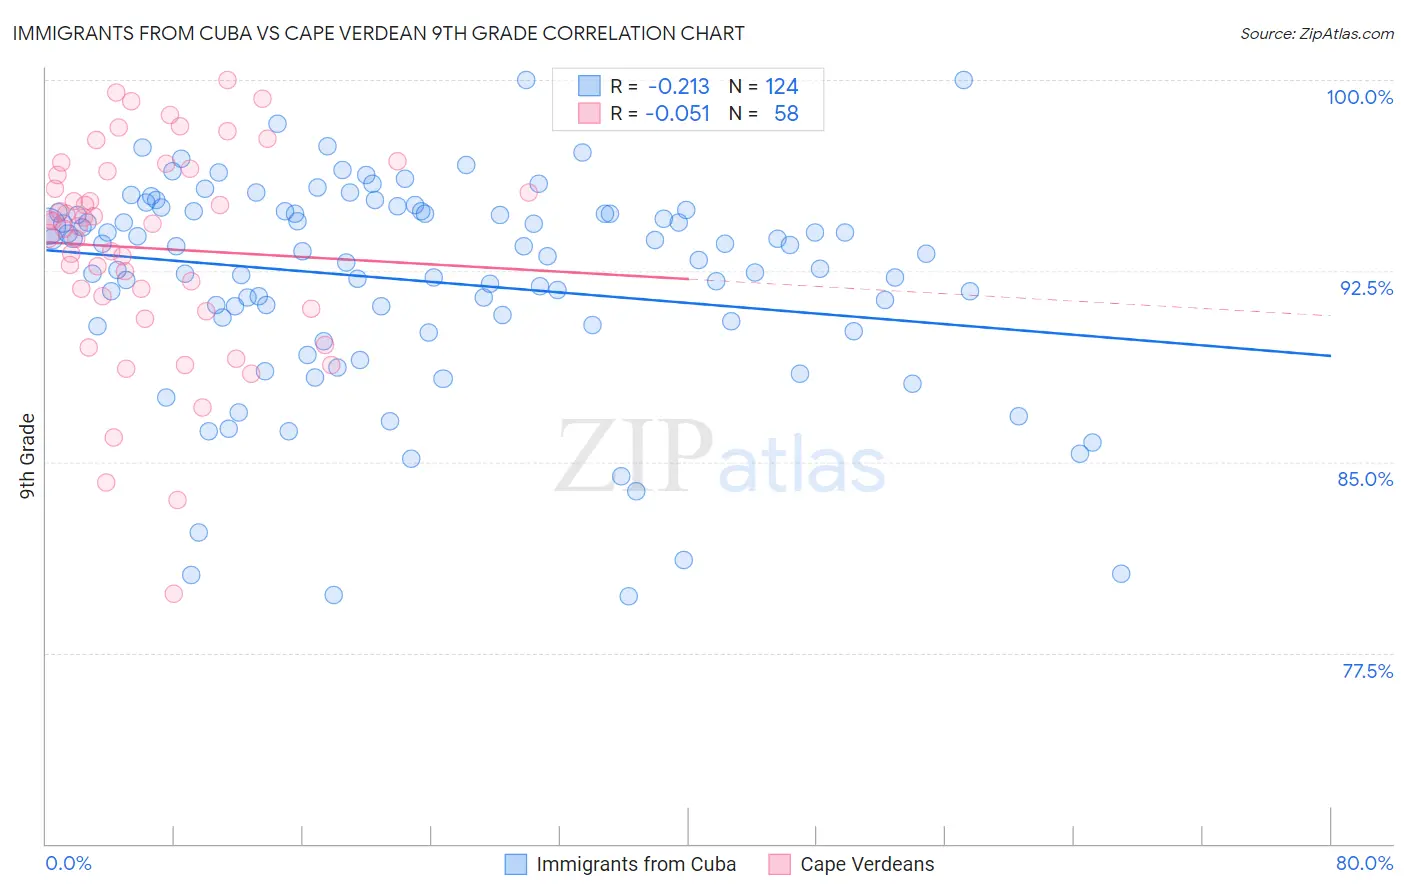
Immigrants from Cuba vs Cape Verdean 9th Grade Correlation Chart
The statistical analysis conducted on geographies consisting of 326,019,170 people shows a weak negative correlation between the proportion of Immigrants from Cuba and percentage of population with at least 9th grade education in the United States with a correlation coefficient (R) of -0.213 and weighted average of 92.2%. Similarly, the statistical analysis conducted on geographies consisting of 107,537,955 people shows a slight negative correlation between the proportion of Cape Verdeans and percentage of population with at least 9th grade education in the United States with a correlation coefficient (R) of -0.051 and weighted average of 92.2%, a difference of 0.010%.
9th Grade Correlation Summary
| Measurement | Immigrants from Cuba | Cape Verdean |
| Minimum | 79.7% | 79.8% |
| Maximum | 100.0% | 100.0% |
| Range | 20.3% | 20.2% |
| Mean | 92.1% | 93.4% |
| Median | 93.2% | 94.3% |
| Interquartile 25% (IQ1) | 90.5% | 91.0% |
| Interquartile 75% (IQ3) | 94.8% | 96.4% |
| Interquartile Range (IQR) | 4.4% | 5.4% |
| Standard Deviation (Sample) | 4.1% | 4.2% |
| Standard Deviation (Population) | 4.1% | 4.2% |
Demographics Similar to Immigrants from Cuba and Cape Verdeans by 9th Grade
In terms of 9th grade, the demographic groups most similar to Immigrants from Cuba are Immigrants from Caribbean (92.2%, a difference of 0.050%), Immigrants from Portugal (92.2%, a difference of 0.060%), Vietnamese (92.3%, a difference of 0.10%), Houma (92.3%, a difference of 0.12%), and Immigrants from Fiji (92.3%, a difference of 0.15%). Similarly, the demographic groups most similar to Cape Verdeans are Immigrants from Caribbean (92.2%, a difference of 0.040%), Immigrants from Portugal (92.2%, a difference of 0.050%), Vietnamese (92.3%, a difference of 0.090%), Houma (92.3%, a difference of 0.11%), and Immigrants from Fiji (92.3%, a difference of 0.14%).
| Demographics | Rating | Rank | 9th Grade |
| Immigrants | Vietnam | 0.0 /100 | #306 | Tragic 92.6% |
| Immigrants | Immigrants | 0.0 /100 | #307 | Tragic 92.5% |
| Immigrants | Guyana | 0.0 /100 | #308 | Tragic 92.5% |
| Immigrants | Bangladesh | 0.0 /100 | #309 | Tragic 92.4% |
| Immigrants | Cambodia | 0.0 /100 | #310 | Tragic 92.4% |
| Immigrants | Fiji | 0.0 /100 | #311 | Tragic 92.3% |
| Houma | 0.0 /100 | #312 | Tragic 92.3% |
| Vietnamese | 0.0 /100 | #313 | Tragic 92.3% |
| Immigrants | Portugal | 0.0 /100 | #314 | Tragic 92.2% |
| Immigrants | Caribbean | 0.0 /100 | #315 | Tragic 92.2% |
| Cape Verdeans | 0.0 /100 | #316 | Tragic 92.2% |
| Immigrants | Cuba | 0.0 /100 | #317 | Tragic 92.2% |
| Nepalese | 0.0 /100 | #318 | Tragic 92.0% |
| Ecuadorians | 0.0 /100 | #319 | Tragic 91.9% |
| Nicaraguans | 0.0 /100 | #320 | Tragic 91.9% |
| Immigrants | Ecuador | 0.0 /100 | #321 | Tragic 91.8% |
| Belizeans | 0.0 /100 | #322 | Tragic 91.8% |
| Puerto Ricans | 0.0 /100 | #323 | Tragic 91.8% |
| Immigrants | Belize | 0.0 /100 | #324 | Tragic 91.8% |
| Central American Indians | 0.0 /100 | #325 | Tragic 91.5% |
| Immigrants | Armenia | 0.0 /100 | #326 | Tragic 91.4% |