Sioux vs Puerto Rican High School Diploma
COMPARE
Sioux
Puerto Rican
High School Diploma
High School Diploma Comparison
Sioux
Puerto Ricans
87.9%
HIGH SCHOOL DIPLOMA
2.7/ 100
METRIC RATING
238th/ 347
METRIC RANK
84.7%
HIGH SCHOOL DIPLOMA
0.0/ 100
METRIC RATING
315th/ 347
METRIC RANK
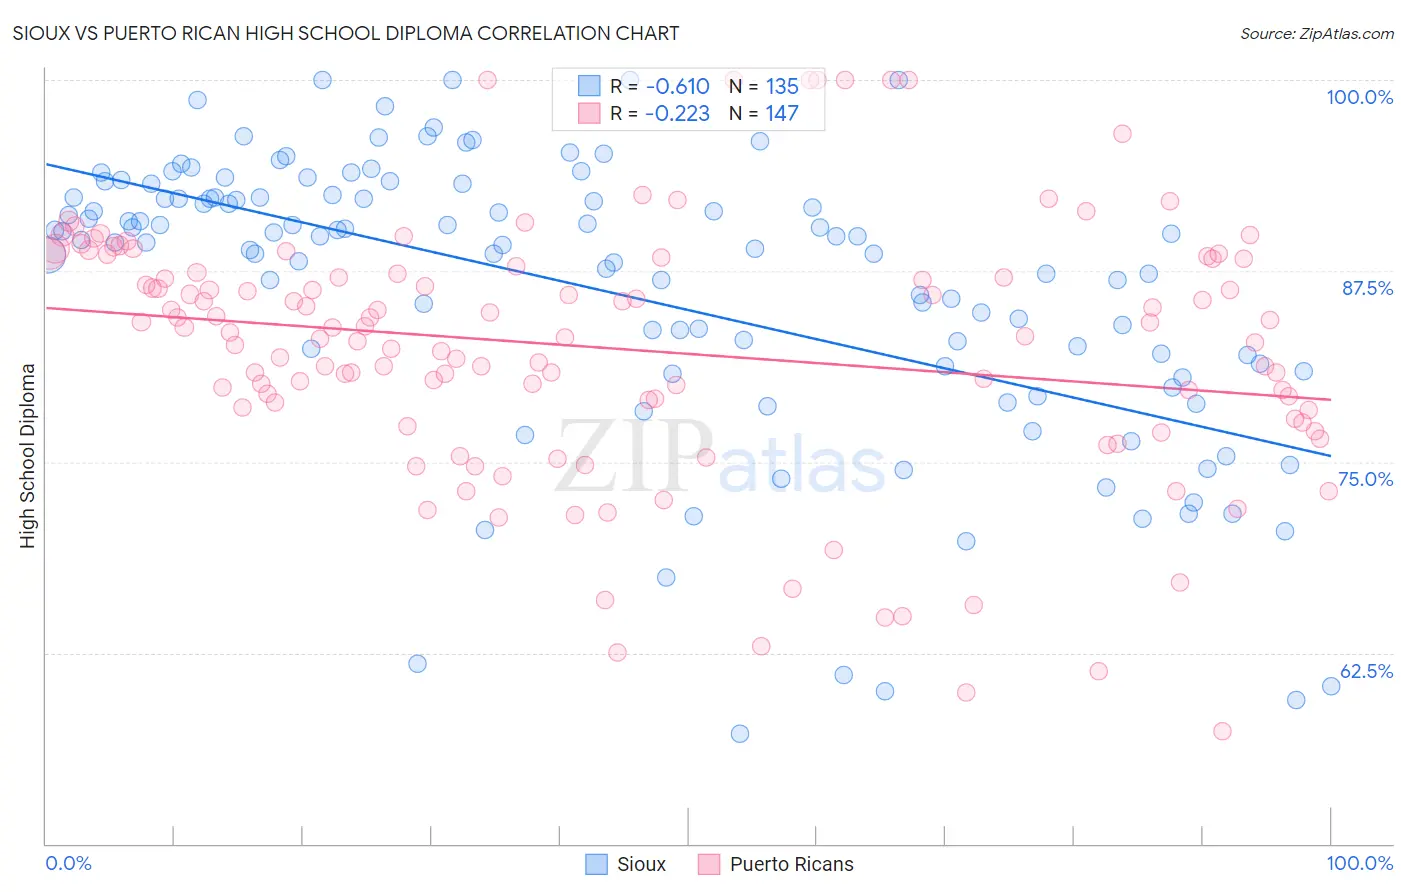
Sioux vs Puerto Rican High School Diploma Correlation Chart
The statistical analysis conducted on geographies consisting of 234,200,396 people shows a significant negative correlation between the proportion of Sioux and percentage of population with at least high school diploma education in the United States with a correlation coefficient (R) of -0.610 and weighted average of 87.9%. Similarly, the statistical analysis conducted on geographies consisting of 528,321,094 people shows a weak negative correlation between the proportion of Puerto Ricans and percentage of population with at least high school diploma education in the United States with a correlation coefficient (R) of -0.223 and weighted average of 84.7%, a difference of 3.9%.
High School Diploma Correlation Summary
| Measurement | Sioux | Puerto Rican |
| Minimum | 57.2% | 57.4% |
| Maximum | 100.0% | 100.0% |
| Range | 42.8% | 42.6% |
| Mean | 86.2% | 82.4% |
| Median | 89.4% | 83.5% |
| Interquartile 25% (IQ1) | 81.3% | 78.4% |
| Interquartile 75% (IQ3) | 92.3% | 87.8% |
| Interquartile Range (IQR) | 11.0% | 9.4% |
| Standard Deviation (Sample) | 9.4% | 8.4% |
| Standard Deviation (Population) | 9.4% | 8.4% |
Similar Demographics by High School Diploma
Demographics Similar to Sioux by High School Diploma
In terms of high school diploma, the demographic groups most similar to Sioux are Taiwanese (87.9%, a difference of 0.0%), South American (87.9%, a difference of 0.0%), Subsaharan African (87.9%, a difference of 0.010%), Immigrants from Bahamas (88.0%, a difference of 0.030%), and Immigrants from Panama (88.0%, a difference of 0.050%).
| Demographics | Rating | Rank | High School Diploma |
| Colombians | 3.8 /100 | #231 | Tragic 88.1% |
| Immigrants | Middle Africa | 3.4 /100 | #232 | Tragic 88.0% |
| Immigrants | Panama | 3.1 /100 | #233 | Tragic 88.0% |
| Immigrants | Thailand | 3.1 /100 | #234 | Tragic 88.0% |
| Immigrants | Bahamas | 2.9 /100 | #235 | Tragic 88.0% |
| Sub-Saharan Africans | 2.8 /100 | #236 | Tragic 87.9% |
| Taiwanese | 2.8 /100 | #237 | Tragic 87.9% |
| Sioux | 2.7 /100 | #238 | Tragic 87.9% |
| South Americans | 2.7 /100 | #239 | Tragic 87.9% |
| Comanche | 2.2 /100 | #240 | Tragic 87.9% |
| Immigrants | Uzbekistan | 2.1 /100 | #241 | Tragic 87.8% |
| Cheyenne | 2.1 /100 | #242 | Tragic 87.8% |
| Immigrants | Philippines | 1.9 /100 | #243 | Tragic 87.8% |
| Choctaw | 1.9 /100 | #244 | Tragic 87.8% |
| Peruvians | 1.9 /100 | #245 | Tragic 87.8% |
Demographics Similar to Puerto Ricans by High School Diploma
In terms of high school diploma, the demographic groups most similar to Puerto Ricans are Yaqui (84.7%, a difference of 0.10%), Immigrants from Ecuador (84.8%, a difference of 0.20%), Belizean (84.3%, a difference of 0.40%), Cape Verdean (85.1%, a difference of 0.46%), and Immigrants from Caribbean (84.3%, a difference of 0.46%).
| Demographics | Rating | Rank | High School Diploma |
| Immigrants | Armenia | 0.0 /100 | #308 | Tragic 85.2% |
| Immigrants | Dominica | 0.0 /100 | #309 | Tragic 85.2% |
| Apache | 0.0 /100 | #310 | Tragic 85.1% |
| Ecuadorians | 0.0 /100 | #311 | Tragic 85.1% |
| Cape Verdeans | 0.0 /100 | #312 | Tragic 85.1% |
| Immigrants | Ecuador | 0.0 /100 | #313 | Tragic 84.8% |
| Yaqui | 0.0 /100 | #314 | Tragic 84.7% |
| Puerto Ricans | 0.0 /100 | #315 | Tragic 84.7% |
| Belizeans | 0.0 /100 | #316 | Tragic 84.3% |
| Immigrants | Caribbean | 0.0 /100 | #317 | Tragic 84.3% |
| Immigrants | Belize | 0.0 /100 | #318 | Tragic 84.2% |
| Central American Indians | 0.0 /100 | #319 | Tragic 84.2% |
| Nicaraguans | 0.0 /100 | #320 | Tragic 84.1% |
| Yuman | 0.0 /100 | #321 | Tragic 84.0% |
| Lumbee | 0.0 /100 | #322 | Tragic 83.6% |