Immigrants from Portugal vs Scottish Professional Degree
COMPARE
Immigrants from Portugal
Scottish
Professional Degree
Professional Degree Comparison
Immigrants from Portugal
Scottish
3.5%
PROFESSIONAL DEGREE
0.5/ 100
METRIC RATING
279th/ 347
METRIC RANK
4.6%
PROFESSIONAL DEGREE
71.8/ 100
METRIC RATING
154th/ 347
METRIC RANK
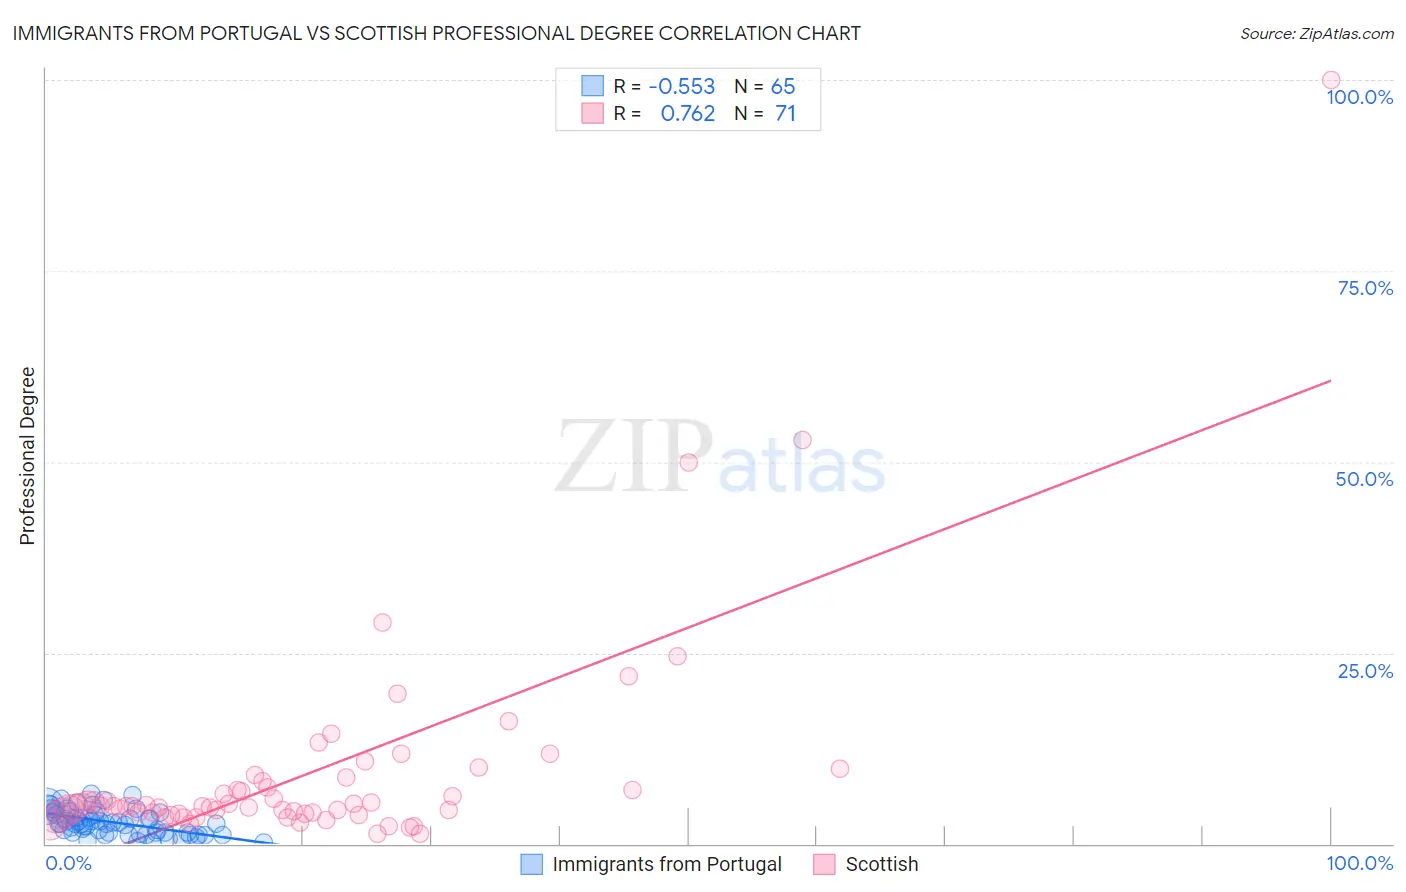
Immigrants from Portugal vs Scottish Professional Degree Correlation Chart
The statistical analysis conducted on geographies consisting of 174,657,094 people shows a substantial negative correlation between the proportion of Immigrants from Portugal and percentage of population with at least professional degree education in the United States with a correlation coefficient (R) of -0.553 and weighted average of 3.5%. Similarly, the statistical analysis conducted on geographies consisting of 558,904,242 people shows a strong positive correlation between the proportion of Scottish and percentage of population with at least professional degree education in the United States with a correlation coefficient (R) of 0.762 and weighted average of 4.6%, a difference of 28.5%.
Professional Degree Correlation Summary
| Measurement | Immigrants from Portugal | Scottish |
| Minimum | 0.14% | 1.3% |
| Maximum | 6.6% | 100.0% |
| Range | 6.5% | 98.7% |
| Mean | 2.8% | 9.2% |
| Median | 2.6% | 4.9% |
| Interquartile 25% (IQ1) | 1.4% | 4.0% |
| Interquartile 75% (IQ3) | 4.1% | 8.2% |
| Interquartile Range (IQR) | 2.7% | 4.2% |
| Standard Deviation (Sample) | 1.6% | 14.2% |
| Standard Deviation (Population) | 1.6% | 14.1% |
Similar Demographics by Professional Degree
Demographics Similar to Immigrants from Portugal by Professional Degree
In terms of professional degree, the demographic groups most similar to Immigrants from Portugal are Japanese (3.5%, a difference of 0.040%), Dominican (3.5%, a difference of 0.040%), Apache (3.5%, a difference of 0.060%), Immigrants from Caribbean (3.5%, a difference of 0.080%), and Cheyenne (3.6%, a difference of 0.10%).
| Demographics | Rating | Rank | Professional Degree |
| Immigrants | Jamaica | 0.5 /100 | #272 | Tragic 3.6% |
| Americans | 0.5 /100 | #273 | Tragic 3.6% |
| Potawatomi | 0.5 /100 | #274 | Tragic 3.6% |
| Immigrants | Dominica | 0.5 /100 | #275 | Tragic 3.6% |
| Liberians | 0.5 /100 | #276 | Tragic 3.6% |
| Cheyenne | 0.5 /100 | #277 | Tragic 3.6% |
| Japanese | 0.5 /100 | #278 | Tragic 3.5% |
| Immigrants | Portugal | 0.5 /100 | #279 | Tragic 3.5% |
| Dominicans | 0.5 /100 | #280 | Tragic 3.5% |
| Apache | 0.5 /100 | #281 | Tragic 3.5% |
| Immigrants | Caribbean | 0.5 /100 | #282 | Tragic 3.5% |
| Comanche | 0.4 /100 | #283 | Tragic 3.5% |
| Salvadorans | 0.4 /100 | #284 | Tragic 3.5% |
| Hondurans | 0.3 /100 | #285 | Tragic 3.5% |
| Haitians | 0.3 /100 | #286 | Tragic 3.5% |
Demographics Similar to Scottish by Professional Degree
In terms of professional degree, the demographic groups most similar to Scottish are Immigrants from Africa (4.6%, a difference of 0.12%), Immigrants from Uruguay (4.6%, a difference of 0.12%), Polish (4.6%, a difference of 0.14%), Slavic (4.5%, a difference of 0.18%), and Immigrants from Oceania (4.6%, a difference of 0.28%).
| Demographics | Rating | Rank | Professional Degree |
| Colombians | 77.7 /100 | #147 | Good 4.6% |
| Slovenes | 76.1 /100 | #148 | Good 4.6% |
| Senegalese | 75.3 /100 | #149 | Good 4.6% |
| Immigrants | Oceania | 73.4 /100 | #150 | Good 4.6% |
| Poles | 72.6 /100 | #151 | Good 4.6% |
| Immigrants | Africa | 72.5 /100 | #152 | Good 4.6% |
| Immigrants | Uruguay | 72.5 /100 | #153 | Good 4.6% |
| Scottish | 71.8 /100 | #154 | Good 4.6% |
| Slavs | 70.8 /100 | #155 | Good 4.5% |
| Swedes | 69.9 /100 | #156 | Good 4.5% |
| Iraqis | 69.8 /100 | #157 | Good 4.5% |
| Immigrants | Armenia | 68.8 /100 | #158 | Good 4.5% |
| Vietnamese | 68.4 /100 | #159 | Good 4.5% |
| Immigrants | Senegal | 68.0 /100 | #160 | Good 4.5% |
| Assyrians/Chaldeans/Syriacs | 67.4 /100 | #161 | Good 4.5% |