Venezuelan vs Malaysian Professional Degree
COMPARE
Venezuelan
Malaysian
Professional Degree
Professional Degree Comparison
Venezuelans
Malaysians
4.9%
PROFESSIONAL DEGREE
96.3/ 100
METRIC RATING
116th/ 347
METRIC RANK
3.4%
PROFESSIONAL DEGREE
0.2/ 100
METRIC RATING
302nd/ 347
METRIC RANK
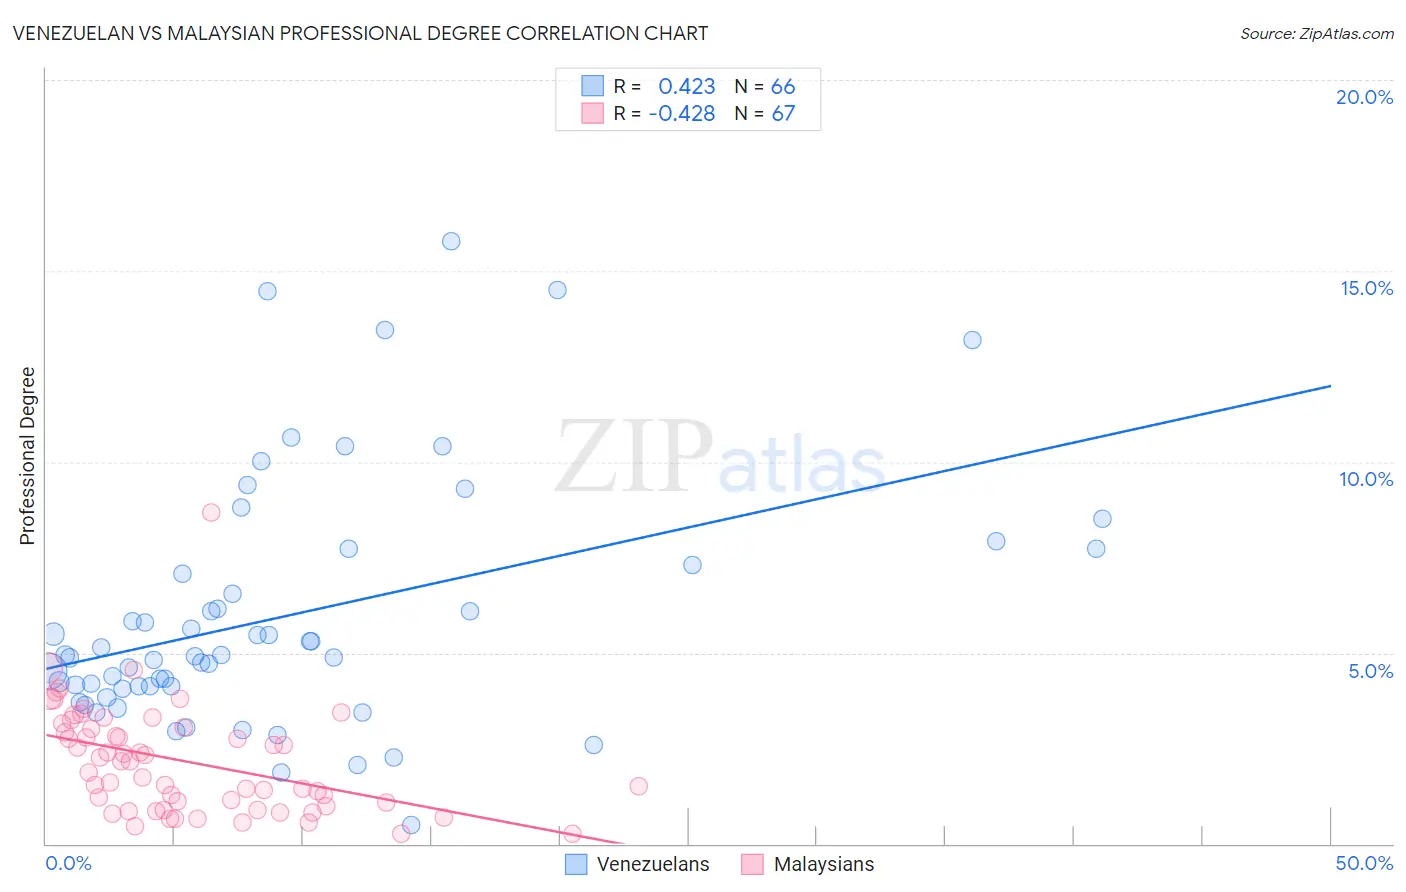
Venezuelan vs Malaysian Professional Degree Correlation Chart
The statistical analysis conducted on geographies consisting of 305,937,617 people shows a moderate positive correlation between the proportion of Venezuelans and percentage of population with at least professional degree education in the United States with a correlation coefficient (R) of 0.423 and weighted average of 4.9%. Similarly, the statistical analysis conducted on geographies consisting of 225,764,269 people shows a moderate negative correlation between the proportion of Malaysians and percentage of population with at least professional degree education in the United States with a correlation coefficient (R) of -0.428 and weighted average of 3.4%, a difference of 45.2%.
Professional Degree Correlation Summary
| Measurement | Venezuelan | Malaysian |
| Minimum | 0.50% | 0.26% |
| Maximum | 15.8% | 8.7% |
| Range | 15.3% | 8.4% |
| Mean | 6.0% | 2.2% |
| Median | 4.9% | 2.1% |
| Interquartile 25% (IQ1) | 4.1% | 0.97% |
| Interquartile 75% (IQ3) | 7.3% | 3.1% |
| Interquartile Range (IQR) | 3.2% | 2.1% |
| Standard Deviation (Sample) | 3.2% | 1.4% |
| Standard Deviation (Population) | 3.2% | 1.4% |
Similar Demographics by Professional Degree
Demographics Similar to Venezuelans by Professional Degree
In terms of professional degree, the demographic groups most similar to Venezuelans are Immigrants from Syria (4.9%, a difference of 0.21%), Croatian (4.9%, a difference of 0.21%), Moroccan (5.0%, a difference of 0.47%), Immigrants from Morocco (5.0%, a difference of 0.57%), and Immigrants from Sudan (4.9%, a difference of 0.75%).
| Demographics | Rating | Rank | Professional Degree |
| British | 98.0 /100 | #109 | Exceptional 5.0% |
| Lebanese | 98.0 /100 | #110 | Exceptional 5.0% |
| Brazilians | 97.4 /100 | #111 | Exceptional 5.0% |
| Taiwanese | 97.3 /100 | #112 | Exceptional 5.0% |
| Immigrants | Pakistan | 97.2 /100 | #113 | Exceptional 5.0% |
| Immigrants | Morocco | 96.8 /100 | #114 | Exceptional 5.0% |
| Moroccans | 96.8 /100 | #115 | Exceptional 5.0% |
| Venezuelans | 96.3 /100 | #116 | Exceptional 4.9% |
| Immigrants | Syria | 96.0 /100 | #117 | Exceptional 4.9% |
| Croatians | 96.0 /100 | #118 | Exceptional 4.9% |
| Immigrants | Sudan | 95.4 /100 | #119 | Exceptional 4.9% |
| Albanians | 95.3 /100 | #120 | Exceptional 4.9% |
| Immigrants | Moldova | 94.8 /100 | #121 | Exceptional 4.9% |
| Immigrants | Germany | 94.1 /100 | #122 | Exceptional 4.9% |
| Immigrants | Venezuela | 93.8 /100 | #123 | Exceptional 4.8% |
Demographics Similar to Malaysians by Professional Degree
In terms of professional degree, the demographic groups most similar to Malaysians are Immigrants from Dominican Republic (3.4%, a difference of 0.11%), Black/African American (3.4%, a difference of 0.25%), Immigrants from Yemen (3.4%, a difference of 0.38%), Immigrants from Haiti (3.4%, a difference of 0.66%), and Cajun (3.4%, a difference of 0.66%).
| Demographics | Rating | Rank | Professional Degree |
| Immigrants | Guatemala | 0.2 /100 | #295 | Tragic 3.4% |
| Hawaiians | 0.2 /100 | #296 | Tragic 3.4% |
| Immigrants | Liberia | 0.2 /100 | #297 | Tragic 3.4% |
| Ottawa | 0.2 /100 | #298 | Tragic 3.4% |
| Immigrants | Yemen | 0.2 /100 | #299 | Tragic 3.4% |
| Blacks/African Americans | 0.2 /100 | #300 | Tragic 3.4% |
| Immigrants | Dominican Republic | 0.2 /100 | #301 | Tragic 3.4% |
| Malaysians | 0.2 /100 | #302 | Tragic 3.4% |
| Immigrants | Haiti | 0.2 /100 | #303 | Tragic 3.4% |
| Cajuns | 0.2 /100 | #304 | Tragic 3.4% |
| Chickasaw | 0.1 /100 | #305 | Tragic 3.4% |
| Cape Verdeans | 0.1 /100 | #306 | Tragic 3.4% |
| Samoans | 0.1 /100 | #307 | Tragic 3.3% |
| Shoshone | 0.1 /100 | #308 | Tragic 3.3% |
| Pima | 0.1 /100 | #309 | Tragic 3.3% |