Immigrants from Czechoslovakia vs Malaysian Professional Degree
COMPARE
Immigrants from Czechoslovakia
Malaysian
Professional Degree
Professional Degree Comparison
Immigrants from Czechoslovakia
Malaysians
5.8%
PROFESSIONAL DEGREE
100.0/ 100
METRIC RATING
50th/ 347
METRIC RANK
3.4%
PROFESSIONAL DEGREE
0.2/ 100
METRIC RATING
302nd/ 347
METRIC RANK
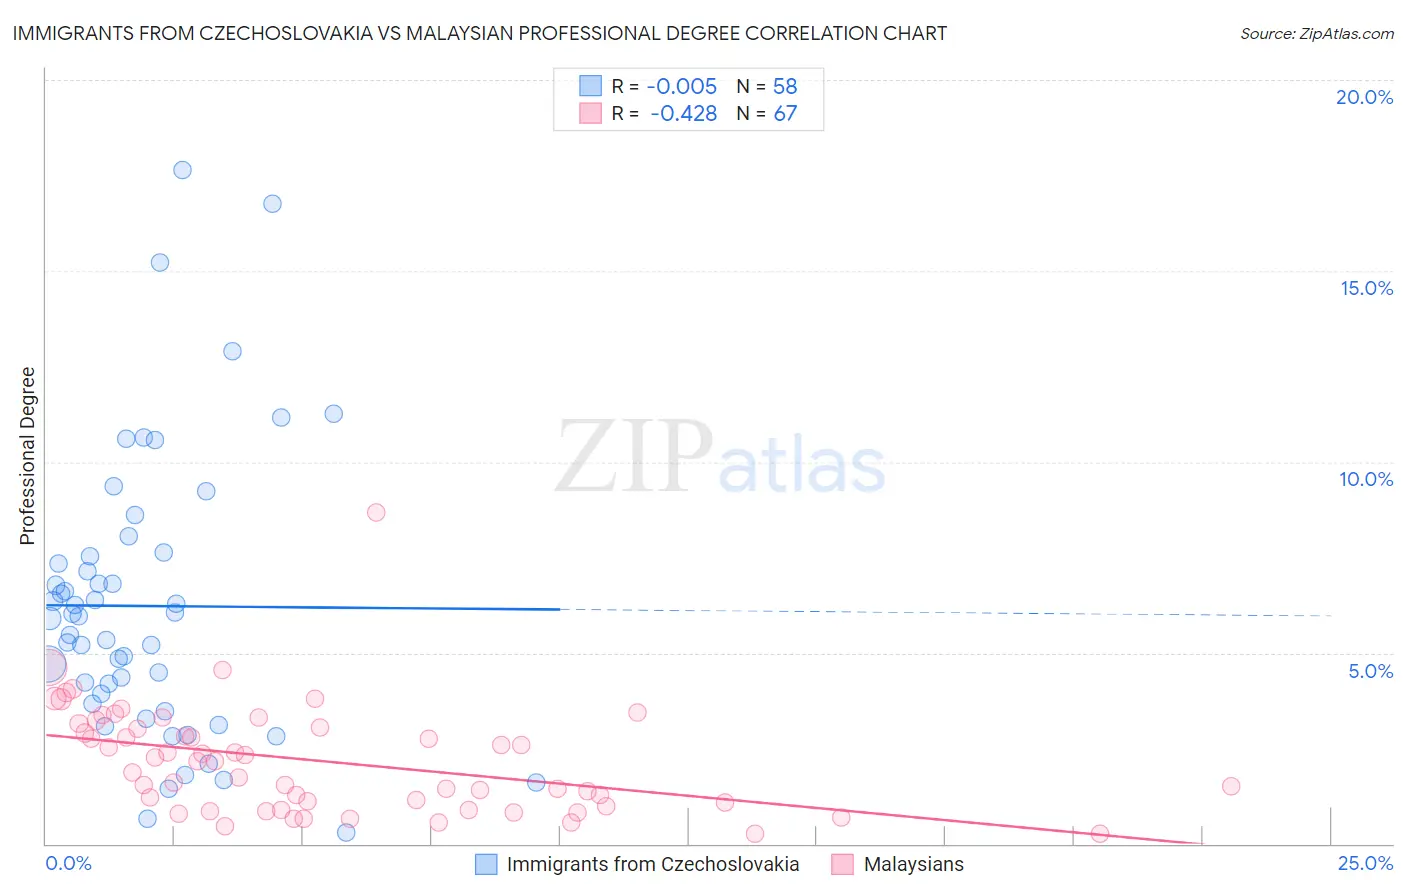
Immigrants from Czechoslovakia vs Malaysian Professional Degree Correlation Chart
The statistical analysis conducted on geographies consisting of 195,354,883 people shows no correlation between the proportion of Immigrants from Czechoslovakia and percentage of population with at least professional degree education in the United States with a correlation coefficient (R) of -0.005 and weighted average of 5.8%. Similarly, the statistical analysis conducted on geographies consisting of 225,764,269 people shows a moderate negative correlation between the proportion of Malaysians and percentage of population with at least professional degree education in the United States with a correlation coefficient (R) of -0.428 and weighted average of 3.4%, a difference of 71.5%.
Professional Degree Correlation Summary
| Measurement | Immigrants from Czechoslovakia | Malaysian |
| Minimum | 0.28% | 0.26% |
| Maximum | 17.6% | 8.7% |
| Range | 17.4% | 8.4% |
| Mean | 6.2% | 2.2% |
| Median | 5.9% | 2.1% |
| Interquartile 25% (IQ1) | 3.7% | 0.97% |
| Interquartile 75% (IQ3) | 7.5% | 3.1% |
| Interquartile Range (IQR) | 3.9% | 2.1% |
| Standard Deviation (Sample) | 3.7% | 1.4% |
| Standard Deviation (Population) | 3.7% | 1.4% |
Similar Demographics by Professional Degree
Demographics Similar to Immigrants from Czechoslovakia by Professional Degree
In terms of professional degree, the demographic groups most similar to Immigrants from Czechoslovakia are Immigrants from Greece (5.8%, a difference of 0.060%), Immigrants from Serbia (5.8%, a difference of 0.13%), Immigrants from Latvia (5.8%, a difference of 0.32%), Immigrants from Netherlands (5.8%, a difference of 0.36%), and Paraguayan (5.9%, a difference of 0.72%).
| Demographics | Rating | Rank | Professional Degree |
| Immigrants | Saudi Arabia | 100.0 /100 | #43 | Exceptional 5.9% |
| Argentineans | 100.0 /100 | #44 | Exceptional 5.9% |
| Immigrants | South Central Asia | 100.0 /100 | #45 | Exceptional 5.9% |
| Immigrants | Argentina | 100.0 /100 | #46 | Exceptional 5.9% |
| Australians | 100.0 /100 | #47 | Exceptional 5.9% |
| Paraguayans | 100.0 /100 | #48 | Exceptional 5.9% |
| Immigrants | Latvia | 100.0 /100 | #49 | Exceptional 5.8% |
| Immigrants | Czechoslovakia | 100.0 /100 | #50 | Exceptional 5.8% |
| Immigrants | Greece | 100.0 /100 | #51 | Exceptional 5.8% |
| Immigrants | Serbia | 100.0 /100 | #52 | Exceptional 5.8% |
| Immigrants | Netherlands | 100.0 /100 | #53 | Exceptional 5.8% |
| Immigrants | Kuwait | 100.0 /100 | #54 | Exceptional 5.7% |
| Immigrants | Western Europe | 100.0 /100 | #55 | Exceptional 5.7% |
| Immigrants | Malaysia | 100.0 /100 | #56 | Exceptional 5.7% |
| South Africans | 100.0 /100 | #57 | Exceptional 5.7% |
Demographics Similar to Malaysians by Professional Degree
In terms of professional degree, the demographic groups most similar to Malaysians are Immigrants from Dominican Republic (3.4%, a difference of 0.11%), Black/African American (3.4%, a difference of 0.25%), Immigrants from Yemen (3.4%, a difference of 0.38%), Immigrants from Haiti (3.4%, a difference of 0.66%), and Cajun (3.4%, a difference of 0.66%).
| Demographics | Rating | Rank | Professional Degree |
| Immigrants | Guatemala | 0.2 /100 | #295 | Tragic 3.4% |
| Hawaiians | 0.2 /100 | #296 | Tragic 3.4% |
| Immigrants | Liberia | 0.2 /100 | #297 | Tragic 3.4% |
| Ottawa | 0.2 /100 | #298 | Tragic 3.4% |
| Immigrants | Yemen | 0.2 /100 | #299 | Tragic 3.4% |
| Blacks/African Americans | 0.2 /100 | #300 | Tragic 3.4% |
| Immigrants | Dominican Republic | 0.2 /100 | #301 | Tragic 3.4% |
| Malaysians | 0.2 /100 | #302 | Tragic 3.4% |
| Immigrants | Haiti | 0.2 /100 | #303 | Tragic 3.4% |
| Cajuns | 0.2 /100 | #304 | Tragic 3.4% |
| Chickasaw | 0.1 /100 | #305 | Tragic 3.4% |
| Cape Verdeans | 0.1 /100 | #306 | Tragic 3.4% |
| Samoans | 0.1 /100 | #307 | Tragic 3.3% |
| Shoshone | 0.1 /100 | #308 | Tragic 3.3% |
| Pima | 0.1 /100 | #309 | Tragic 3.3% |