Immigrants from Singapore vs Malaysian Professional Degree
COMPARE
Immigrants from Singapore
Malaysian
Professional Degree
Professional Degree Comparison
Immigrants from Singapore
Malaysians
7.7%
PROFESSIONAL DEGREE
100.0/ 100
METRIC RATING
2nd/ 347
METRIC RANK
3.4%
PROFESSIONAL DEGREE
0.2/ 100
METRIC RATING
302nd/ 347
METRIC RANK
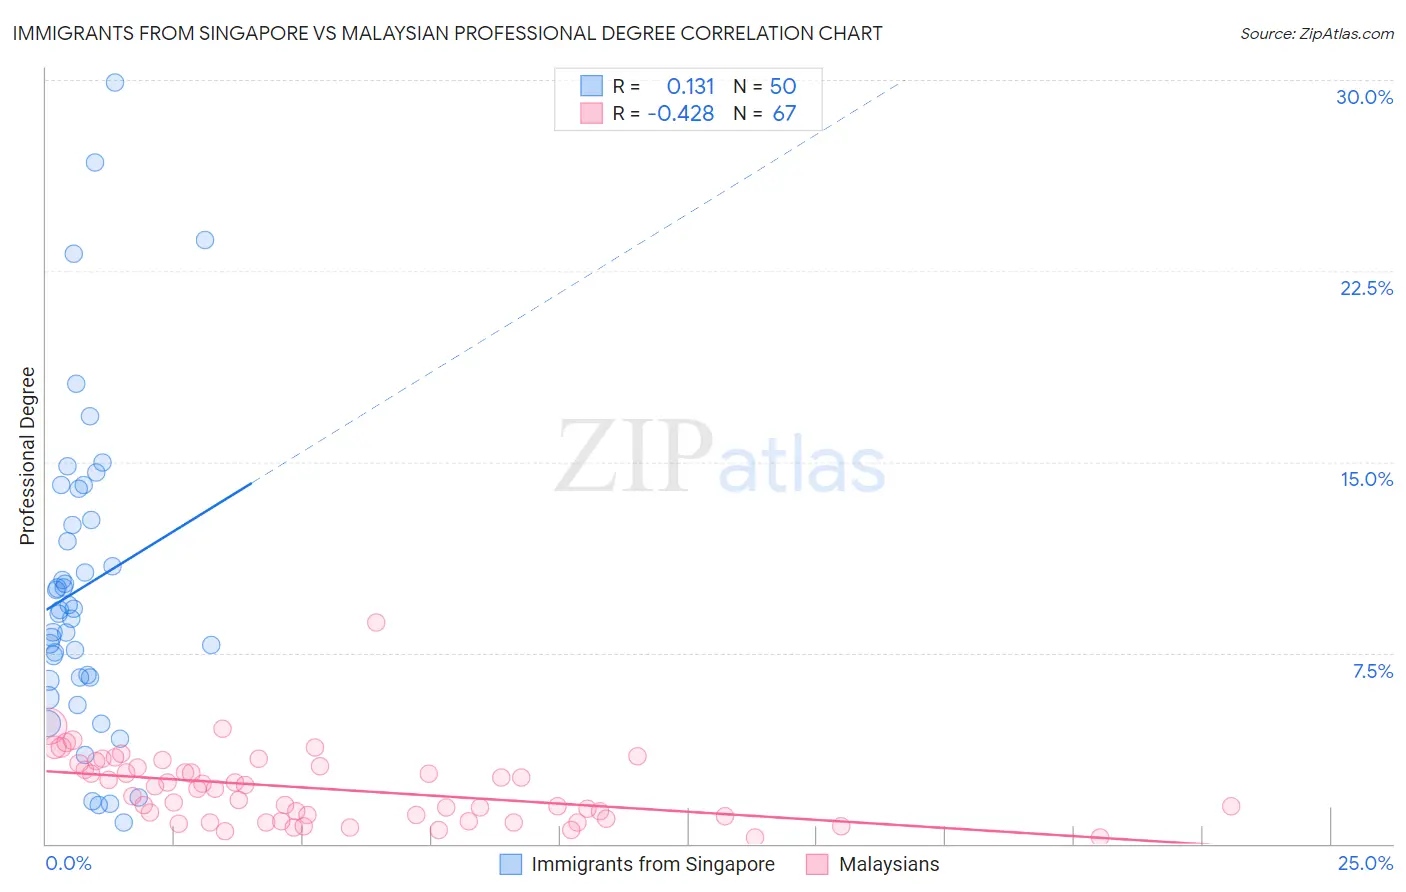
Immigrants from Singapore vs Malaysian Professional Degree Correlation Chart
The statistical analysis conducted on geographies consisting of 137,446,133 people shows a poor positive correlation between the proportion of Immigrants from Singapore and percentage of population with at least professional degree education in the United States with a correlation coefficient (R) of 0.131 and weighted average of 7.7%. Similarly, the statistical analysis conducted on geographies consisting of 225,764,269 people shows a moderate negative correlation between the proportion of Malaysians and percentage of population with at least professional degree education in the United States with a correlation coefficient (R) of -0.428 and weighted average of 3.4%, a difference of 128.1%.
Professional Degree Correlation Summary
| Measurement | Immigrants from Singapore | Malaysian |
| Minimum | 0.83% | 0.26% |
| Maximum | 29.9% | 8.7% |
| Range | 29.1% | 8.4% |
| Mean | 10.1% | 2.2% |
| Median | 9.1% | 2.1% |
| Interquartile 25% (IQ1) | 6.5% | 0.97% |
| Interquartile 75% (IQ3) | 12.7% | 3.1% |
| Interquartile Range (IQR) | 6.2% | 2.1% |
| Standard Deviation (Sample) | 6.2% | 1.4% |
| Standard Deviation (Population) | 6.2% | 1.4% |
Similar Demographics by Professional Degree
Demographics Similar to Immigrants from Singapore by Professional Degree
In terms of professional degree, the demographic groups most similar to Immigrants from Singapore are Immigrants from Israel (7.9%, a difference of 1.4%), Iranian (7.6%, a difference of 1.6%), Filipino (7.6%, a difference of 2.4%), Immigrants from Iran (7.3%, a difference of 5.7%), and Okinawan (7.3%, a difference of 5.8%).
| Demographics | Rating | Rank | Professional Degree |
| Immigrants | Israel | 100.0 /100 | #1 | Exceptional 7.9% |
| Immigrants | Singapore | 100.0 /100 | #2 | Exceptional 7.7% |
| Iranians | 100.0 /100 | #3 | Exceptional 7.6% |
| Filipinos | 100.0 /100 | #4 | Exceptional 7.6% |
| Immigrants | Iran | 100.0 /100 | #5 | Exceptional 7.3% |
| Okinawans | 100.0 /100 | #6 | Exceptional 7.3% |
| Eastern Europeans | 100.0 /100 | #7 | Exceptional 7.1% |
| Immigrants | Switzerland | 100.0 /100 | #8 | Exceptional 7.1% |
| Immigrants | Taiwan | 100.0 /100 | #9 | Exceptional 7.1% |
| Immigrants | Belgium | 100.0 /100 | #10 | Exceptional 7.0% |
| Cypriots | 100.0 /100 | #11 | Exceptional 6.9% |
| Israelis | 100.0 /100 | #12 | Exceptional 6.9% |
| Immigrants | Australia | 100.0 /100 | #13 | Exceptional 6.9% |
| Immigrants | France | 100.0 /100 | #14 | Exceptional 6.8% |
| Immigrants | China | 100.0 /100 | #15 | Exceptional 6.7% |
Demographics Similar to Malaysians by Professional Degree
In terms of professional degree, the demographic groups most similar to Malaysians are Immigrants from Dominican Republic (3.4%, a difference of 0.11%), Black/African American (3.4%, a difference of 0.25%), Immigrants from Yemen (3.4%, a difference of 0.38%), Immigrants from Haiti (3.4%, a difference of 0.66%), and Cajun (3.4%, a difference of 0.66%).
| Demographics | Rating | Rank | Professional Degree |
| Immigrants | Guatemala | 0.2 /100 | #295 | Tragic 3.4% |
| Hawaiians | 0.2 /100 | #296 | Tragic 3.4% |
| Immigrants | Liberia | 0.2 /100 | #297 | Tragic 3.4% |
| Ottawa | 0.2 /100 | #298 | Tragic 3.4% |
| Immigrants | Yemen | 0.2 /100 | #299 | Tragic 3.4% |
| Blacks/African Americans | 0.2 /100 | #300 | Tragic 3.4% |
| Immigrants | Dominican Republic | 0.2 /100 | #301 | Tragic 3.4% |
| Malaysians | 0.2 /100 | #302 | Tragic 3.4% |
| Immigrants | Haiti | 0.2 /100 | #303 | Tragic 3.4% |
| Cajuns | 0.2 /100 | #304 | Tragic 3.4% |
| Chickasaw | 0.1 /100 | #305 | Tragic 3.4% |
| Cape Verdeans | 0.1 /100 | #306 | Tragic 3.4% |
| Samoans | 0.1 /100 | #307 | Tragic 3.3% |
| Shoshone | 0.1 /100 | #308 | Tragic 3.3% |
| Pima | 0.1 /100 | #309 | Tragic 3.3% |