Immigrants from Trinidad and Tobago vs Immigrants from Poland Associate's Degree
COMPARE
Immigrants from Trinidad and Tobago
Immigrants from Poland
Associate's Degree
Associate's Degree Comparison
Immigrants from Trinidad and Tobago
Immigrants from Poland
43.3%
ASSOCIATE'S DEGREE
3.0/ 100
METRIC RATING
229th/ 347
METRIC RANK
47.1%
ASSOCIATE'S DEGREE
69.2/ 100
METRIC RATING
159th/ 347
METRIC RANK
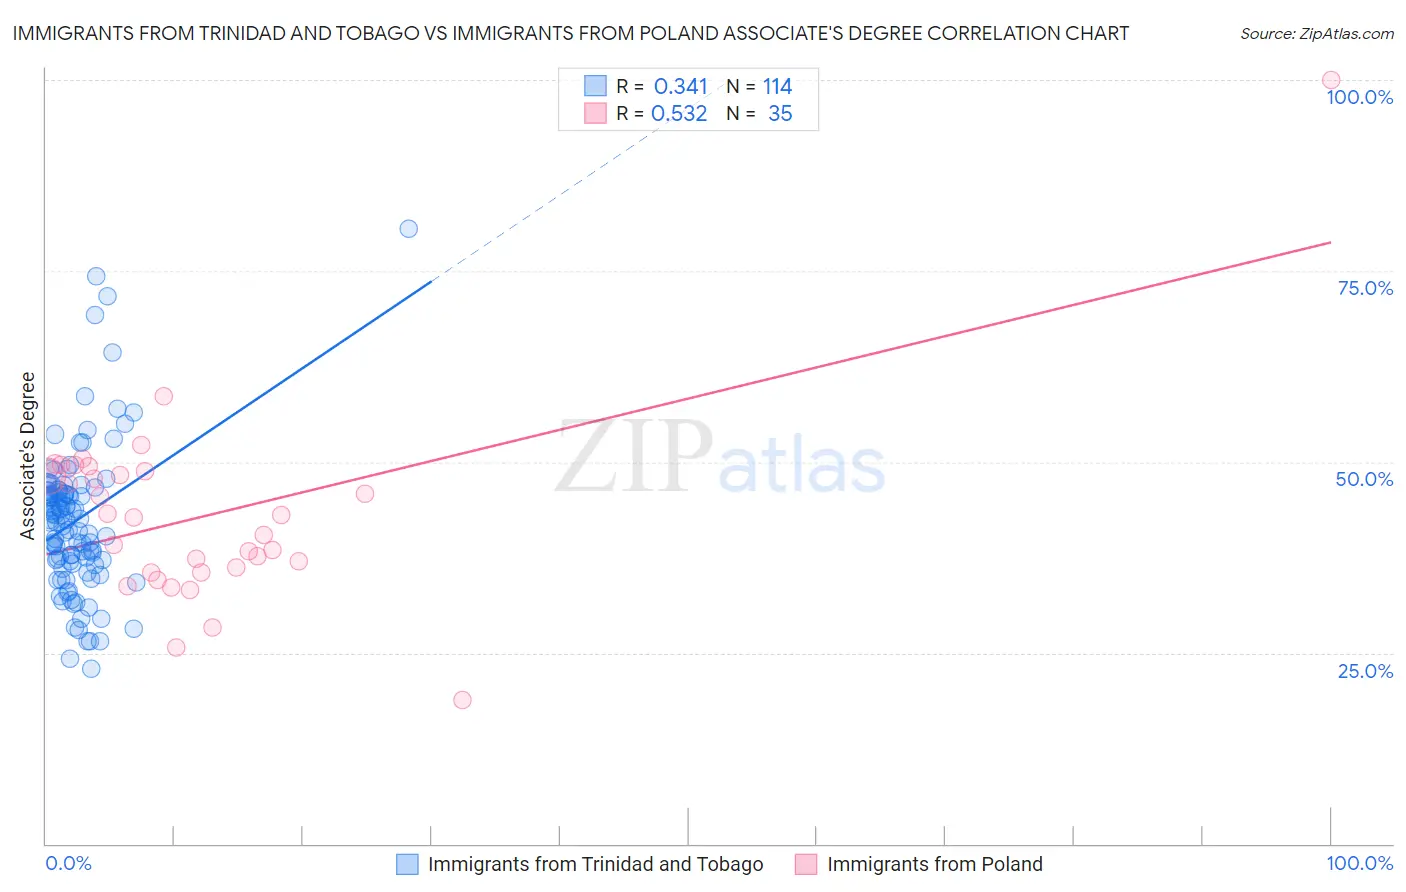
Immigrants from Trinidad and Tobago vs Immigrants from Poland Associate's Degree Correlation Chart
The statistical analysis conducted on geographies consisting of 223,520,472 people shows a mild positive correlation between the proportion of Immigrants from Trinidad and Tobago and percentage of population with at least associate's degree education in the United States with a correlation coefficient (R) of 0.341 and weighted average of 43.3%. Similarly, the statistical analysis conducted on geographies consisting of 304,854,598 people shows a substantial positive correlation between the proportion of Immigrants from Poland and percentage of population with at least associate's degree education in the United States with a correlation coefficient (R) of 0.532 and weighted average of 47.1%, a difference of 8.6%.
Associate's Degree Correlation Summary
| Measurement | Immigrants from Trinidad and Tobago | Immigrants from Poland |
| Minimum | 23.0% | 18.8% |
| Maximum | 80.5% | 100.0% |
| Range | 57.6% | 81.2% |
| Mean | 42.4% | 42.9% |
| Median | 42.4% | 42.8% |
| Interquartile 25% (IQ1) | 37.0% | 35.5% |
| Interquartile 75% (IQ3) | 46.1% | 48.8% |
| Interquartile Range (IQR) | 9.1% | 13.2% |
| Standard Deviation (Sample) | 9.7% | 13.0% |
| Standard Deviation (Population) | 9.7% | 12.8% |
Similar Demographics by Associate's Degree
Demographics Similar to Immigrants from Trinidad and Tobago by Associate's Degree
In terms of associate's degree, the demographic groups most similar to Immigrants from Trinidad and Tobago are Immigrants from Barbados (43.3%, a difference of 0.070%), Liberian (43.3%, a difference of 0.080%), Hmong (43.4%, a difference of 0.16%), Native Hawaiian (43.1%, a difference of 0.50%), and Trinidadian and Tobagonian (43.6%, a difference of 0.60%).
| Demographics | Rating | Rank | Associate's Degree |
| Barbadians | 5.8 /100 | #222 | Tragic 43.9% |
| Sub-Saharan Africans | 5.5 /100 | #223 | Tragic 43.9% |
| West Indians | 5.2 /100 | #224 | Tragic 43.8% |
| Guamanians/Chamorros | 4.8 /100 | #225 | Tragic 43.8% |
| Immigrants | Burma/Myanmar | 4.3 /100 | #226 | Tragic 43.7% |
| Trinidadians and Tobagonians | 4.0 /100 | #227 | Tragic 43.6% |
| Hmong | 3.2 /100 | #228 | Tragic 43.4% |
| Immigrants | Trinidad and Tobago | 3.0 /100 | #229 | Tragic 43.3% |
| Immigrants | Barbados | 2.9 /100 | #230 | Tragic 43.3% |
| Liberians | 2.9 /100 | #231 | Tragic 43.3% |
| Native Hawaiians | 2.3 /100 | #232 | Tragic 43.1% |
| Tongans | 2.2 /100 | #233 | Tragic 43.0% |
| Tlingit-Haida | 2.1 /100 | #234 | Tragic 43.0% |
| Ecuadorians | 2.0 /100 | #235 | Tragic 43.0% |
| Immigrants | St. Vincent and the Grenadines | 1.9 /100 | #236 | Tragic 42.9% |
Demographics Similar to Immigrants from Poland by Associate's Degree
In terms of associate's degree, the demographic groups most similar to Immigrants from Poland are Immigrants from Germany (47.1%, a difference of 0.050%), Sudanese (47.1%, a difference of 0.090%), South American (47.1%, a difference of 0.12%), Kenyan (47.1%, a difference of 0.13%), and Immigrants from Kenya (47.2%, a difference of 0.26%).
| Demographics | Rating | Rank | Associate's Degree |
| Immigrants | Afghanistan | 74.3 /100 | #152 | Good 47.3% |
| Czechs | 72.2 /100 | #153 | Good 47.2% |
| Immigrants | Kenya | 72.1 /100 | #154 | Good 47.2% |
| Kenyans | 70.6 /100 | #155 | Good 47.1% |
| South Americans | 70.5 /100 | #156 | Good 47.1% |
| Sudanese | 70.3 /100 | #157 | Good 47.1% |
| Immigrants | Germany | 69.7 /100 | #158 | Good 47.1% |
| Immigrants | Poland | 69.2 /100 | #159 | Good 47.1% |
| Scottish | 65.4 /100 | #160 | Good 46.9% |
| Scandinavians | 65.2 /100 | #161 | Good 46.9% |
| Immigrants | Africa | 63.2 /100 | #162 | Good 46.8% |
| Somalis | 62.5 /100 | #163 | Good 46.8% |
| Colombians | 62.4 /100 | #164 | Good 46.8% |
| Immigrants | South America | 59.9 /100 | #165 | Average 46.7% |
| Hungarians | 59.3 /100 | #166 | Average 46.7% |