Shoshone vs Yup'ik 11th Grade
COMPARE
Shoshone
Yup'ik
11th Grade
11th Grade Comparison
Shoshone
Yup'ik
92.5%
11TH GRADE
48.9/ 100
METRIC RATING
175th/ 347
METRIC RANK
91.2%
11TH GRADE
0.3/ 100
METRIC RATING
264th/ 347
METRIC RANK
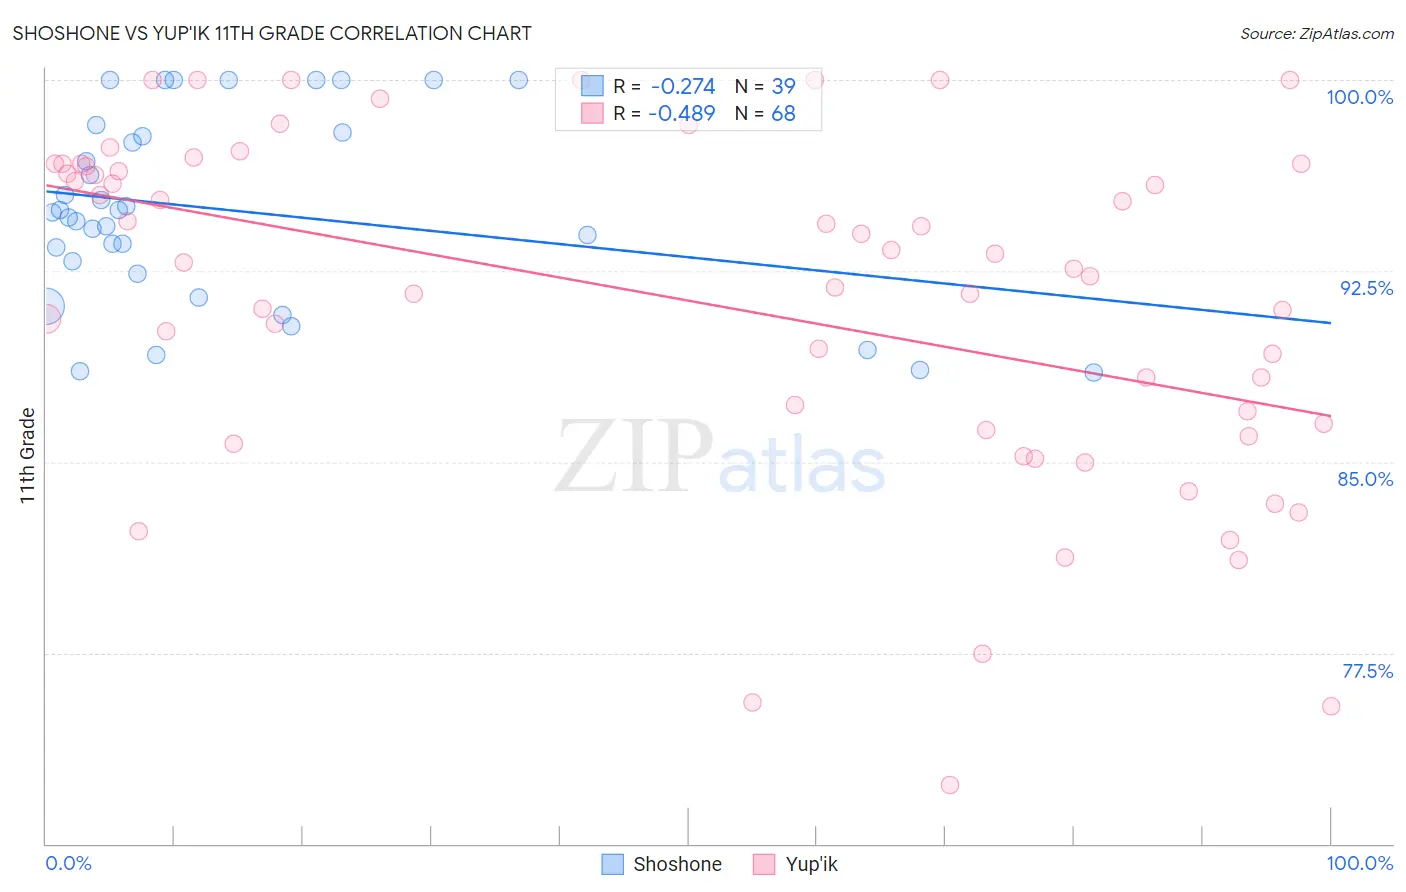
Shoshone vs Yup'ik 11th Grade Correlation Chart
The statistical analysis conducted on geographies consisting of 66,625,086 people shows a weak negative correlation between the proportion of Shoshone and percentage of population with at least 11th grade education in the United States with a correlation coefficient (R) of -0.274 and weighted average of 92.5%. Similarly, the statistical analysis conducted on geographies consisting of 39,964,654 people shows a moderate negative correlation between the proportion of Yup'ik and percentage of population with at least 11th grade education in the United States with a correlation coefficient (R) of -0.489 and weighted average of 91.2%, a difference of 1.4%.
11th Grade Correlation Summary
| Measurement | Shoshone | Yup'ik |
| Minimum | 88.5% | 72.3% |
| Maximum | 100.0% | 100.0% |
| Range | 11.5% | 27.7% |
| Mean | 94.9% | 91.3% |
| Median | 94.8% | 92.7% |
| Interquartile 25% (IQ1) | 92.4% | 86.4% |
| Interquartile 75% (IQ3) | 97.9% | 96.7% |
| Interquartile Range (IQR) | 5.5% | 10.3% |
| Standard Deviation (Sample) | 3.7% | 6.8% |
| Standard Deviation (Population) | 3.6% | 6.7% |
Similar Demographics by 11th Grade
Demographics Similar to Shoshone by 11th Grade
In terms of 11th grade, the demographic groups most similar to Shoshone are Asian (92.5%, a difference of 0.010%), Spaniard (92.5%, a difference of 0.020%), Immigrants from Pakistan (92.5%, a difference of 0.030%), Indian (Asian) (92.5%, a difference of 0.030%), and Guamanian/Chamorro (92.5%, a difference of 0.040%).
| Demographics | Rating | Rank | 11th Grade |
| Sierra Leoneans | 58.7 /100 | #168 | Average 92.6% |
| Immigrants | Albania | 57.8 /100 | #169 | Average 92.6% |
| Immigrants | Northern Africa | 57.3 /100 | #170 | Average 92.6% |
| Laotians | 54.4 /100 | #171 | Average 92.6% |
| Immigrants | Pakistan | 52.3 /100 | #172 | Average 92.5% |
| Indians (Asian) | 51.5 /100 | #173 | Average 92.5% |
| Asians | 50.0 /100 | #174 | Average 92.5% |
| Shoshone | 48.9 /100 | #175 | Average 92.5% |
| Spaniards | 46.9 /100 | #176 | Average 92.5% |
| Guamanians/Chamorros | 45.0 /100 | #177 | Average 92.5% |
| Sudanese | 43.4 /100 | #178 | Average 92.5% |
| Creek | 40.9 /100 | #179 | Average 92.4% |
| Inupiat | 40.7 /100 | #180 | Average 92.4% |
| Cherokee | 40.7 /100 | #181 | Average 92.4% |
| Immigrants | Morocco | 38.6 /100 | #182 | Fair 92.4% |
Demographics Similar to Yup'ik by 11th Grade
In terms of 11th grade, the demographic groups most similar to Yup'ik are Pueblo (91.2%, a difference of 0.0%), Immigrants from Ghana (91.2%, a difference of 0.020%), Immigrants from Western Africa (91.2%, a difference of 0.030%), Immigrants from Jamaica (91.2%, a difference of 0.030%), and U.S. Virgin Islander (91.1%, a difference of 0.11%).
| Demographics | Rating | Rank | 11th Grade |
| Cajuns | 0.7 /100 | #257 | Tragic 91.4% |
| Immigrants | Colombia | 0.6 /100 | #258 | Tragic 91.4% |
| Jamaicans | 0.6 /100 | #259 | Tragic 91.4% |
| Spanish Americans | 0.6 /100 | #260 | Tragic 91.4% |
| Taiwanese | 0.6 /100 | #261 | Tragic 91.3% |
| Immigrants | Uruguay | 0.5 /100 | #262 | Tragic 91.3% |
| Immigrants | Ghana | 0.3 /100 | #263 | Tragic 91.2% |
| Yup'ik | 0.3 /100 | #264 | Tragic 91.2% |
| Pueblo | 0.3 /100 | #265 | Tragic 91.2% |
| Immigrants | Western Africa | 0.3 /100 | #266 | Tragic 91.2% |
| Immigrants | Jamaica | 0.3 /100 | #267 | Tragic 91.2% |
| U.S. Virgin Islanders | 0.2 /100 | #268 | Tragic 91.1% |
| Ute | 0.2 /100 | #269 | Tragic 91.1% |
| Trinidadians and Tobagonians | 0.2 /100 | #270 | Tragic 91.1% |
| Immigrants | Peru | 0.1 /100 | #271 | Tragic 91.0% |