Shoshone vs Cuban Single Father Households
COMPARE
Shoshone
Cuban
Single Father Households
Single Father Households Comparison
Shoshone
Cubans
2.6%
SINGLE FATHER HOUSEHOLDS
0.1/ 100
METRIC RATING
277th/ 347
METRIC RANK
2.6%
SINGLE FATHER HOUSEHOLDS
0.3/ 100
METRIC RATING
269th/ 347
METRIC RANK
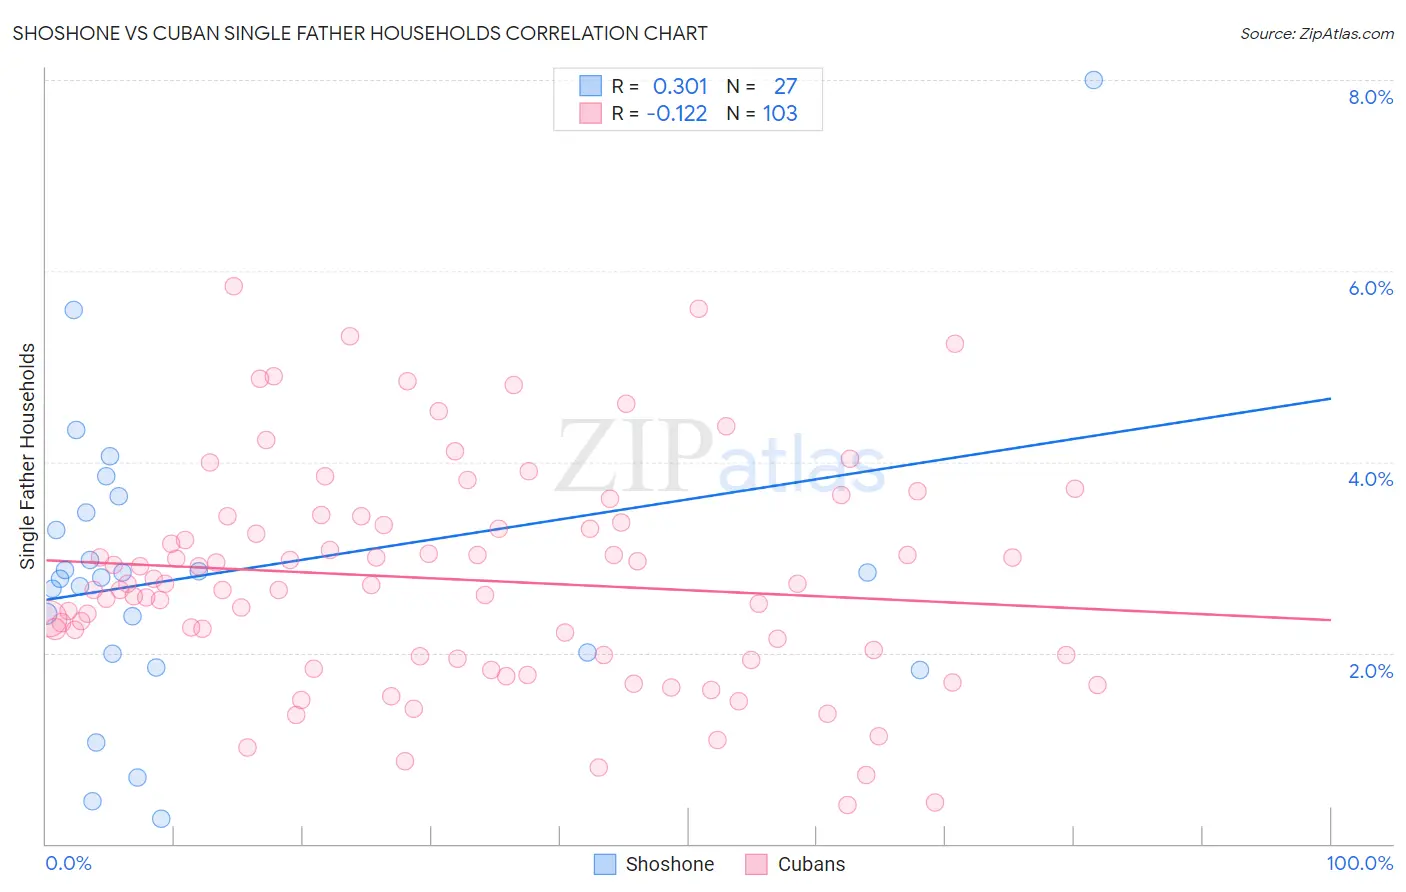
Shoshone vs Cuban Single Father Households Correlation Chart
The statistical analysis conducted on geographies consisting of 66,467,409 people shows a mild positive correlation between the proportion of Shoshone and percentage of single father households in the United States with a correlation coefficient (R) of 0.301 and weighted average of 2.6%. Similarly, the statistical analysis conducted on geographies consisting of 444,378,615 people shows a poor negative correlation between the proportion of Cubans and percentage of single father households in the United States with a correlation coefficient (R) of -0.122 and weighted average of 2.6%, a difference of 1.2%.
Single Father Households Correlation Summary
| Measurement | Shoshone | Cuban |
| Minimum | 0.27% | 0.41% |
| Maximum | 8.0% | 5.8% |
| Range | 7.7% | 5.4% |
| Mean | 2.8% | 2.8% |
| Median | 2.8% | 2.7% |
| Interquartile 25% (IQ1) | 2.0% | 2.0% |
| Interquartile 75% (IQ3) | 3.5% | 3.4% |
| Interquartile Range (IQR) | 1.5% | 1.4% |
| Standard Deviation (Sample) | 1.6% | 1.1% |
| Standard Deviation (Population) | 1.5% | 1.1% |
Demographics Similar to Shoshone and Cubans by Single Father Households
In terms of single father households, the demographic groups most similar to Shoshone are Immigrants from Haiti (2.6%, a difference of 0.030%), Cherokee (2.6%, a difference of 0.050%), Samoan (2.6%, a difference of 0.090%), Immigrants from Dominican Republic (2.6%, a difference of 0.24%), and Immigrants from Portugal (2.6%, a difference of 0.64%). Similarly, the demographic groups most similar to Cubans are Seminole (2.6%, a difference of 0.14%), Haitian (2.6%, a difference of 0.34%), Guamanian/Chamorro (2.6%, a difference of 0.38%), Creek (2.6%, a difference of 0.50%), and Belizean (2.6%, a difference of 0.50%).
| Demographics | Rating | Rank | Single Father Households |
| Dominicans | 0.8 /100 | #263 | Tragic 2.5% |
| Indonesians | 0.5 /100 | #264 | Tragic 2.6% |
| Immigrants | Micronesia | 0.5 /100 | #265 | Tragic 2.6% |
| French American Indians | 0.5 /100 | #266 | Tragic 2.6% |
| Guamanians/Chamorros | 0.4 /100 | #267 | Tragic 2.6% |
| Haitians | 0.4 /100 | #268 | Tragic 2.6% |
| Cubans | 0.3 /100 | #269 | Tragic 2.6% |
| Seminole | 0.3 /100 | #270 | Tragic 2.6% |
| Creek | 0.2 /100 | #271 | Tragic 2.6% |
| Belizeans | 0.2 /100 | #272 | Tragic 2.6% |
| Iroquois | 0.2 /100 | #273 | Tragic 2.6% |
| Puerto Ricans | 0.2 /100 | #274 | Tragic 2.6% |
| Immigrants | Dominican Republic | 0.2 /100 | #275 | Tragic 2.6% |
| Immigrants | Haiti | 0.1 /100 | #276 | Tragic 2.6% |
| Shoshone | 0.1 /100 | #277 | Tragic 2.6% |
| Cherokee | 0.1 /100 | #278 | Tragic 2.6% |
| Samoans | 0.1 /100 | #279 | Tragic 2.6% |
| Immigrants | Portugal | 0.1 /100 | #280 | Tragic 2.6% |
| Nicaraguans | 0.1 /100 | #281 | Tragic 2.6% |
| Dutch West Indians | 0.1 /100 | #282 | Tragic 2.6% |
| Immigrants | Nicaragua | 0.1 /100 | #283 | Tragic 2.7% |