Serbian vs Immigrants from Kazakhstan Professional Degree
COMPARE
Serbian
Immigrants from Kazakhstan
Professional Degree
Professional Degree Comparison
Serbians
Immigrants from Kazakhstan
4.8%
PROFESSIONAL DEGREE
92.6/ 100
METRIC RATING
127th/ 347
METRIC RANK
5.5%
PROFESSIONAL DEGREE
99.9/ 100
METRIC RATING
66th/ 347
METRIC RANK
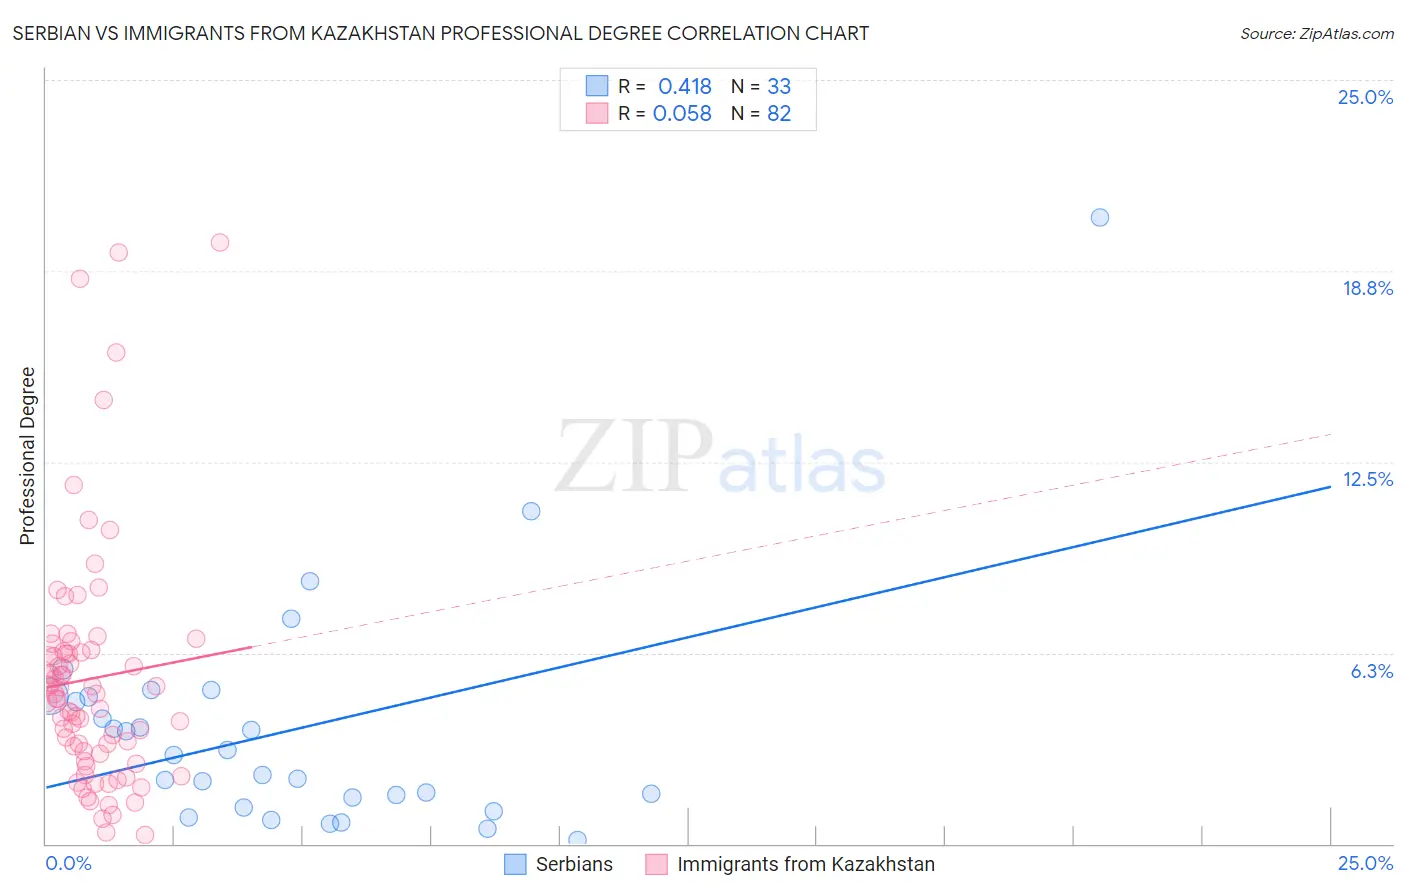
Serbian vs Immigrants from Kazakhstan Professional Degree Correlation Chart
The statistical analysis conducted on geographies consisting of 267,248,415 people shows a moderate positive correlation between the proportion of Serbians and percentage of population with at least professional degree education in the United States with a correlation coefficient (R) of 0.418 and weighted average of 4.8%. Similarly, the statistical analysis conducted on geographies consisting of 124,400,013 people shows a slight positive correlation between the proportion of Immigrants from Kazakhstan and percentage of population with at least professional degree education in the United States with a correlation coefficient (R) of 0.058 and weighted average of 5.5%, a difference of 14.1%.
Professional Degree Correlation Summary
| Measurement | Serbian | Immigrants from Kazakhstan |
| Minimum | 0.11% | 0.30% |
| Maximum | 20.5% | 19.7% |
| Range | 20.4% | 19.4% |
| Mean | 3.7% | 5.4% |
| Median | 2.9% | 4.8% |
| Interquartile 25% (IQ1) | 1.4% | 2.9% |
| Interquartile 75% (IQ3) | 4.8% | 6.3% |
| Interquartile Range (IQR) | 3.5% | 3.4% |
| Standard Deviation (Sample) | 3.9% | 3.9% |
| Standard Deviation (Population) | 3.8% | 3.9% |
Similar Demographics by Professional Degree
Demographics Similar to Serbians by Professional Degree
In terms of professional degree, the demographic groups most similar to Serbians are Immigrants from Eastern Africa (4.8%, a difference of 0.020%), European (4.8%, a difference of 0.30%), Immigrants from Albania (4.8%, a difference of 0.35%), Immigrants from Eritrea (4.8%, a difference of 0.47%), and Palestinian (4.8%, a difference of 0.48%).
| Demographics | Rating | Rank | Professional Degree |
| Albanians | 95.3 /100 | #120 | Exceptional 4.9% |
| Immigrants | Moldova | 94.8 /100 | #121 | Exceptional 4.9% |
| Immigrants | Germany | 94.1 /100 | #122 | Exceptional 4.9% |
| Immigrants | Venezuela | 93.8 /100 | #123 | Exceptional 4.8% |
| Immigrants | Eritrea | 93.5 /100 | #124 | Exceptional 4.8% |
| Immigrants | Albania | 93.3 /100 | #125 | Exceptional 4.8% |
| Europeans | 93.2 /100 | #126 | Exceptional 4.8% |
| Serbians | 92.6 /100 | #127 | Exceptional 4.8% |
| Immigrants | Eastern Africa | 92.5 /100 | #128 | Exceptional 4.8% |
| Palestinians | 91.5 /100 | #129 | Exceptional 4.8% |
| Icelanders | 91.5 /100 | #130 | Exceptional 4.8% |
| Immigrants | Nepal | 91.4 /100 | #131 | Exceptional 4.8% |
| Pakistanis | 90.9 /100 | #132 | Exceptional 4.8% |
| Italians | 90.2 /100 | #133 | Exceptional 4.8% |
| South American Indians | 89.9 /100 | #134 | Excellent 4.8% |
Demographics Similar to Immigrants from Kazakhstan by Professional Degree
In terms of professional degree, the demographic groups most similar to Immigrants from Kazakhstan are Immigrants from Bolivia (5.5%, a difference of 0.24%), Immigrants from Asia (5.5%, a difference of 0.30%), Immigrants from Bulgaria (5.5%, a difference of 0.32%), Asian (5.5%, a difference of 0.36%), and Immigrants from Lebanon (5.5%, a difference of 0.51%).
| Demographics | Rating | Rank | Professional Degree |
| Immigrants | Europe | 100.0 /100 | #59 | Exceptional 5.6% |
| Bolivians | 99.9 /100 | #60 | Exceptional 5.6% |
| Immigrants | Lithuania | 99.9 /100 | #61 | Exceptional 5.6% |
| Immigrants | Belarus | 99.9 /100 | #62 | Exceptional 5.5% |
| Asians | 99.9 /100 | #63 | Exceptional 5.5% |
| Immigrants | Asia | 99.9 /100 | #64 | Exceptional 5.5% |
| Immigrants | Bolivia | 99.9 /100 | #65 | Exceptional 5.5% |
| Immigrants | Kazakhstan | 99.9 /100 | #66 | Exceptional 5.5% |
| Immigrants | Bulgaria | 99.9 /100 | #67 | Exceptional 5.5% |
| Immigrants | Lebanon | 99.9 /100 | #68 | Exceptional 5.5% |
| Immigrants | Hungary | 99.9 /100 | #69 | Exceptional 5.5% |
| Bhutanese | 99.8 /100 | #70 | Exceptional 5.4% |
| Immigrants | Western Asia | 99.8 /100 | #71 | Exceptional 5.4% |
| Lithuanians | 99.8 /100 | #72 | Exceptional 5.4% |
| Immigrants | Romania | 99.8 /100 | #73 | Exceptional 5.4% |