Serbian vs Scandinavian Disability Age 65 to 74
COMPARE
Serbian
Scandinavian
Disability Age 65 to 74
Disability Age 65 to 74 Comparison
Serbians
Scandinavians
22.3%
DISABILITY AGE 65 TO 74
95.7/ 100
METRIC RATING
111th/ 347
METRIC RANK
23.4%
DISABILITY AGE 65 TO 74
45.6/ 100
METRIC RATING
180th/ 347
METRIC RANK
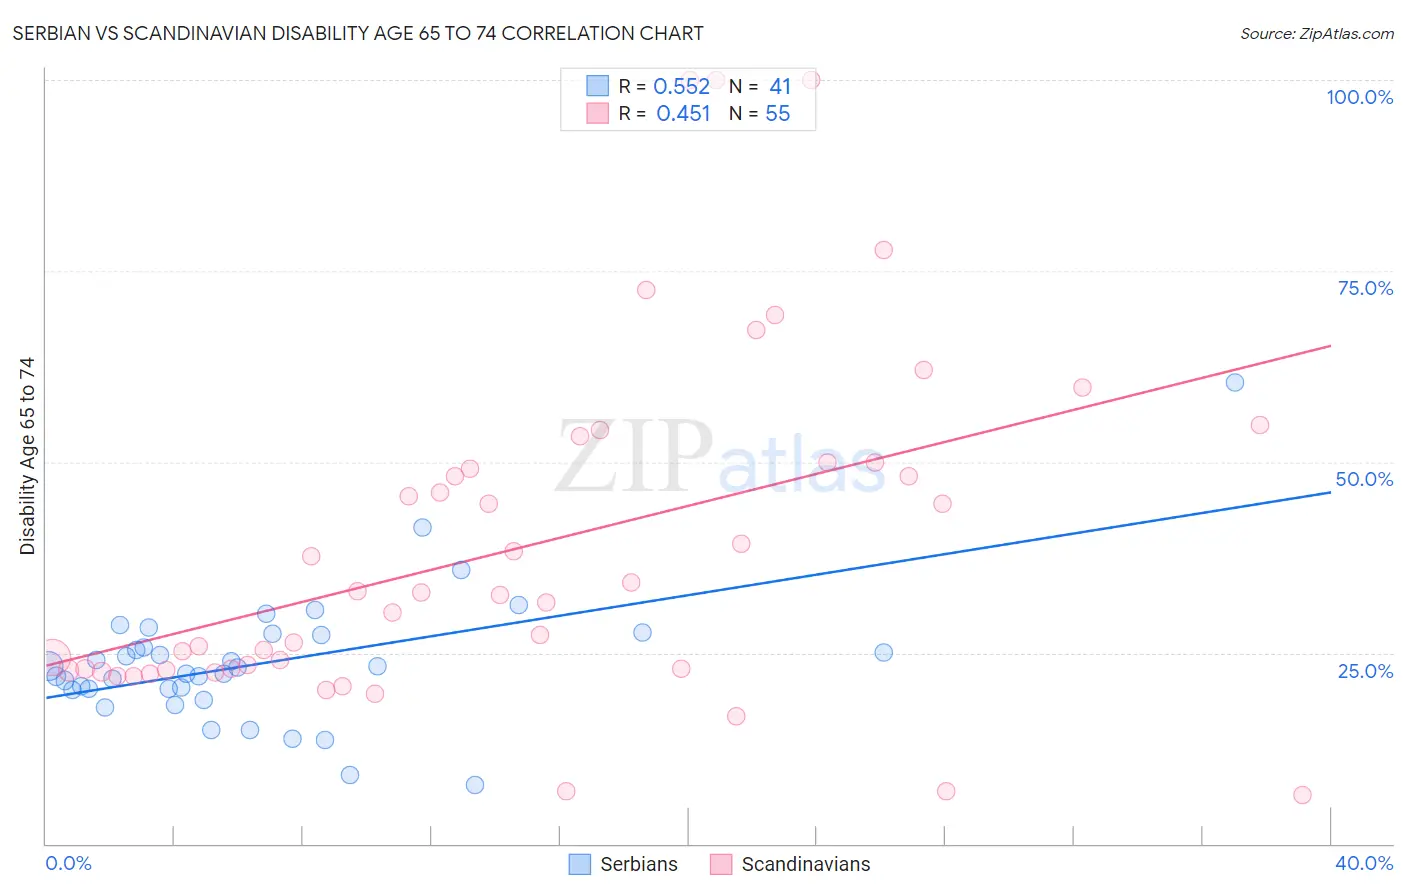
Serbian vs Scandinavian Disability Age 65 to 74 Correlation Chart
The statistical analysis conducted on geographies consisting of 267,379,392 people shows a substantial positive correlation between the proportion of Serbians and percentage of population with a disability between the ages 65 and 75 in the United States with a correlation coefficient (R) of 0.552 and weighted average of 22.3%. Similarly, the statistical analysis conducted on geographies consisting of 471,353,341 people shows a moderate positive correlation between the proportion of Scandinavians and percentage of population with a disability between the ages 65 and 75 in the United States with a correlation coefficient (R) of 0.451 and weighted average of 23.4%, a difference of 5.0%.
Disability Age 65 to 74 Correlation Summary
| Measurement | Serbian | Scandinavian |
| Minimum | 7.7% | 6.4% |
| Maximum | 60.4% | 100.0% |
| Range | 52.8% | 93.6% |
| Mean | 23.7% | 38.7% |
| Median | 23.1% | 32.5% |
| Interquartile 25% (IQ1) | 20.2% | 22.7% |
| Interquartile 75% (IQ3) | 27.4% | 50.0% |
| Interquartile Range (IQR) | 7.2% | 27.3% |
| Standard Deviation (Sample) | 8.7% | 22.4% |
| Standard Deviation (Population) | 8.6% | 22.2% |
Similar Demographics by Disability Age 65 to 74
Demographics Similar to Serbians by Disability Age 65 to 74
In terms of disability age 65 to 74, the demographic groups most similar to Serbians are Immigrants from Peru (22.3%, a difference of 0.020%), Immigrants from South America (22.3%, a difference of 0.060%), Albanian (22.3%, a difference of 0.070%), Syrian (22.3%, a difference of 0.11%), and Immigrants from Zimbabwe (22.3%, a difference of 0.16%).
| Demographics | Rating | Rank | Disability Age 65 to 74 |
| Colombians | 96.4 /100 | #104 | Exceptional 22.2% |
| Palestinians | 96.3 /100 | #105 | Exceptional 22.2% |
| Peruvians | 96.1 /100 | #106 | Exceptional 22.2% |
| Slovenes | 96.1 /100 | #107 | Exceptional 22.2% |
| Immigrants | Zimbabwe | 96.1 /100 | #108 | Exceptional 22.3% |
| Albanians | 95.8 /100 | #109 | Exceptional 22.3% |
| Immigrants | Peru | 95.7 /100 | #110 | Exceptional 22.3% |
| Serbians | 95.7 /100 | #111 | Exceptional 22.3% |
| Immigrants | South America | 95.5 /100 | #112 | Exceptional 22.3% |
| Syrians | 95.3 /100 | #113 | Exceptional 22.3% |
| Ukrainians | 95.1 /100 | #114 | Exceptional 22.3% |
| Laotians | 94.9 /100 | #115 | Exceptional 22.3% |
| Brazilians | 94.8 /100 | #116 | Exceptional 22.4% |
| Swedes | 94.7 /100 | #117 | Exceptional 22.4% |
| Austrians | 94.7 /100 | #118 | Exceptional 22.4% |
Demographics Similar to Scandinavians by Disability Age 65 to 74
In terms of disability age 65 to 74, the demographic groups most similar to Scandinavians are Immigrants from Sierra Leone (23.4%, a difference of 0.010%), Assyrian/Chaldean/Syriac (23.4%, a difference of 0.010%), Guyanese (23.4%, a difference of 0.020%), Irish (23.4%, a difference of 0.070%), and Immigrants from Haiti (23.4%, a difference of 0.11%).
| Demographics | Rating | Rank | Disability Age 65 to 74 |
| Yugoslavians | 50.2 /100 | #173 | Average 23.3% |
| Immigrants | South Eastern Asia | 50.0 /100 | #174 | Average 23.3% |
| Dutch | 49.4 /100 | #175 | Average 23.3% |
| Immigrants | Eritrea | 47.5 /100 | #176 | Average 23.4% |
| Immigrants | Haiti | 47.5 /100 | #177 | Average 23.4% |
| Guyanese | 45.8 /100 | #178 | Average 23.4% |
| Immigrants | Sierra Leone | 45.8 /100 | #179 | Average 23.4% |
| Scandinavians | 45.6 /100 | #180 | Average 23.4% |
| Assyrians/Chaldeans/Syriacs | 45.3 /100 | #181 | Average 23.4% |
| Irish | 44.4 /100 | #182 | Average 23.4% |
| Immigrants | Eastern Africa | 42.8 /100 | #183 | Average 23.4% |
| Immigrants | Germany | 42.5 /100 | #184 | Average 23.4% |
| Haitians | 42.4 /100 | #185 | Average 23.4% |
| Basques | 38.4 /100 | #186 | Fair 23.5% |
| Portuguese | 37.8 /100 | #187 | Fair 23.5% |