Serbian vs Immigrants from Peru Professional Degree
COMPARE
Serbian
Immigrants from Peru
Professional Degree
Professional Degree Comparison
Serbians
Immigrants from Peru
4.8%
PROFESSIONAL DEGREE
92.6/ 100
METRIC RATING
127th/ 347
METRIC RANK
4.4%
PROFESSIONAL DEGREE
49.3/ 100
METRIC RATING
176th/ 347
METRIC RANK
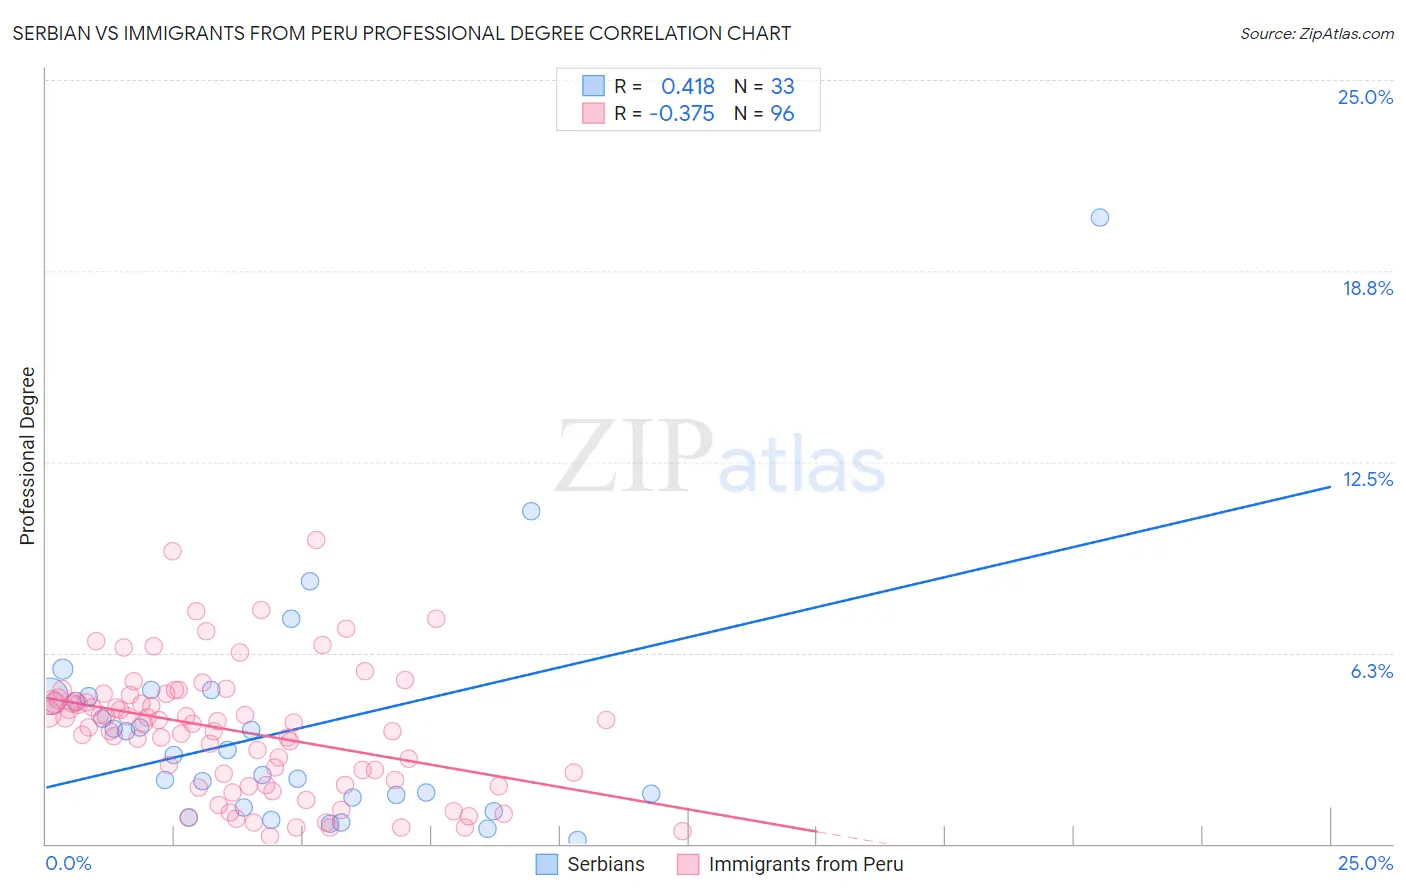
Serbian vs Immigrants from Peru Professional Degree Correlation Chart
The statistical analysis conducted on geographies consisting of 267,248,415 people shows a moderate positive correlation between the proportion of Serbians and percentage of population with at least professional degree education in the United States with a correlation coefficient (R) of 0.418 and weighted average of 4.8%. Similarly, the statistical analysis conducted on geographies consisting of 328,575,904 people shows a mild negative correlation between the proportion of Immigrants from Peru and percentage of population with at least professional degree education in the United States with a correlation coefficient (R) of -0.375 and weighted average of 4.4%, a difference of 9.3%.
Professional Degree Correlation Summary
| Measurement | Serbian | Immigrants from Peru |
| Minimum | 0.11% | 0.24% |
| Maximum | 20.5% | 9.9% |
| Range | 20.4% | 9.7% |
| Mean | 3.7% | 3.7% |
| Median | 2.9% | 3.9% |
| Interquartile 25% (IQ1) | 1.4% | 2.0% |
| Interquartile 75% (IQ3) | 4.8% | 4.7% |
| Interquartile Range (IQR) | 3.5% | 2.7% |
| Standard Deviation (Sample) | 3.9% | 2.0% |
| Standard Deviation (Population) | 3.8% | 2.0% |
Similar Demographics by Professional Degree
Demographics Similar to Serbians by Professional Degree
In terms of professional degree, the demographic groups most similar to Serbians are Immigrants from Eastern Africa (4.8%, a difference of 0.020%), European (4.8%, a difference of 0.30%), Immigrants from Albania (4.8%, a difference of 0.35%), Immigrants from Eritrea (4.8%, a difference of 0.47%), and Palestinian (4.8%, a difference of 0.48%).
| Demographics | Rating | Rank | Professional Degree |
| Albanians | 95.3 /100 | #120 | Exceptional 4.9% |
| Immigrants | Moldova | 94.8 /100 | #121 | Exceptional 4.9% |
| Immigrants | Germany | 94.1 /100 | #122 | Exceptional 4.9% |
| Immigrants | Venezuela | 93.8 /100 | #123 | Exceptional 4.8% |
| Immigrants | Eritrea | 93.5 /100 | #124 | Exceptional 4.8% |
| Immigrants | Albania | 93.3 /100 | #125 | Exceptional 4.8% |
| Europeans | 93.2 /100 | #126 | Exceptional 4.8% |
| Serbians | 92.6 /100 | #127 | Exceptional 4.8% |
| Immigrants | Eastern Africa | 92.5 /100 | #128 | Exceptional 4.8% |
| Palestinians | 91.5 /100 | #129 | Exceptional 4.8% |
| Icelanders | 91.5 /100 | #130 | Exceptional 4.8% |
| Immigrants | Nepal | 91.4 /100 | #131 | Exceptional 4.8% |
| Pakistanis | 90.9 /100 | #132 | Exceptional 4.8% |
| Italians | 90.2 /100 | #133 | Exceptional 4.8% |
| South American Indians | 89.9 /100 | #134 | Excellent 4.8% |
Demographics Similar to Immigrants from Peru by Professional Degree
In terms of professional degree, the demographic groups most similar to Immigrants from Peru are Kenyan (4.4%, a difference of 0.10%), Irish (4.4%, a difference of 0.10%), English (4.4%, a difference of 0.11%), Celtic (4.4%, a difference of 0.25%), and Spaniard (4.4%, a difference of 0.39%).
| Demographics | Rating | Rank | Professional Degree |
| Chinese | 58.6 /100 | #169 | Average 4.5% |
| Immigrants | Zaire | 57.4 /100 | #170 | Average 4.5% |
| Immigrants | Bangladesh | 56.0 /100 | #171 | Average 4.4% |
| Spaniards | 52.0 /100 | #172 | Average 4.4% |
| English | 50.1 /100 | #173 | Average 4.4% |
| Kenyans | 50.0 /100 | #174 | Average 4.4% |
| Irish | 50.0 /100 | #175 | Average 4.4% |
| Immigrants | Peru | 49.3 /100 | #176 | Average 4.4% |
| Celtics | 47.6 /100 | #177 | Average 4.4% |
| Immigrants | Costa Rica | 46.7 /100 | #178 | Average 4.4% |
| Immigrants | Kenya | 45.9 /100 | #179 | Average 4.4% |
| Czechs | 44.9 /100 | #180 | Average 4.4% |
| Danes | 43.5 /100 | #181 | Average 4.4% |
| Immigrants | Immigrants | 43.2 /100 | #182 | Average 4.4% |
| Bermudans | 43.1 /100 | #183 | Average 4.4% |