Serbian vs Guamanian/Chamorro Professional Degree
COMPARE
Serbian
Guamanian/Chamorro
Professional Degree
Professional Degree Comparison
Serbians
Guamanians/Chamorros
4.8%
PROFESSIONAL DEGREE
92.6/ 100
METRIC RATING
127th/ 347
METRIC RANK
3.8%
PROFESSIONAL DEGREE
2.2/ 100
METRIC RATING
243rd/ 347
METRIC RANK
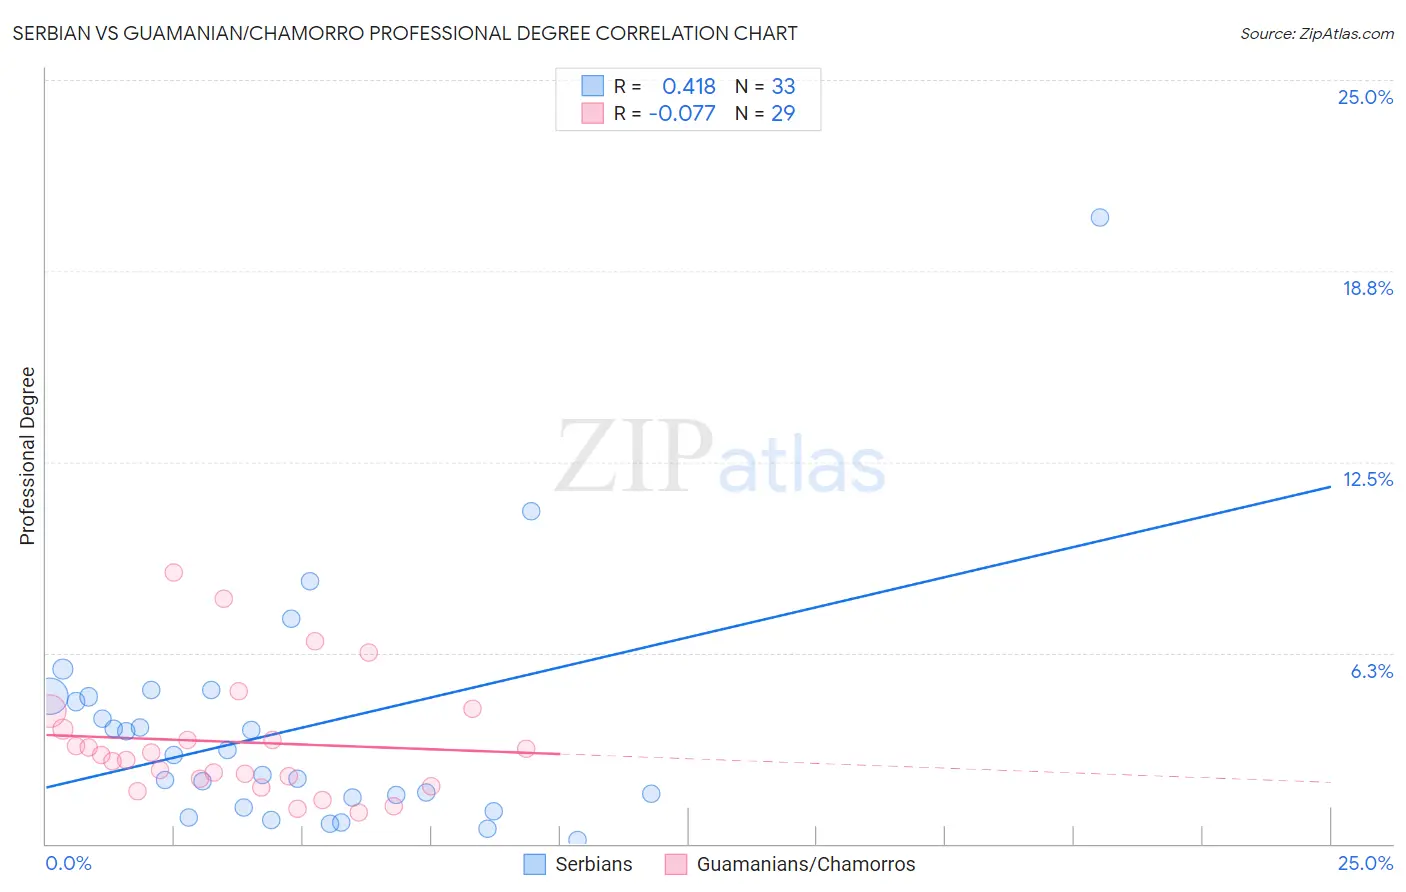
Serbian vs Guamanian/Chamorro Professional Degree Correlation Chart
The statistical analysis conducted on geographies consisting of 267,248,415 people shows a moderate positive correlation between the proportion of Serbians and percentage of population with at least professional degree education in the United States with a correlation coefficient (R) of 0.418 and weighted average of 4.8%. Similarly, the statistical analysis conducted on geographies consisting of 221,637,971 people shows a slight negative correlation between the proportion of Guamanians/Chamorros and percentage of population with at least professional degree education in the United States with a correlation coefficient (R) of -0.077 and weighted average of 3.8%, a difference of 26.5%.
Professional Degree Correlation Summary
| Measurement | Serbian | Guamanian/Chamorro |
| Minimum | 0.11% | 1.0% |
| Maximum | 20.5% | 8.9% |
| Range | 20.4% | 7.8% |
| Mean | 3.7% | 3.3% |
| Median | 2.9% | 2.9% |
| Interquartile 25% (IQ1) | 1.4% | 2.0% |
| Interquartile 75% (IQ3) | 4.8% | 4.0% |
| Interquartile Range (IQR) | 3.5% | 2.1% |
| Standard Deviation (Sample) | 3.9% | 2.0% |
| Standard Deviation (Population) | 3.8% | 1.9% |
Similar Demographics by Professional Degree
Demographics Similar to Serbians by Professional Degree
In terms of professional degree, the demographic groups most similar to Serbians are Immigrants from Eastern Africa (4.8%, a difference of 0.020%), European (4.8%, a difference of 0.30%), Immigrants from Albania (4.8%, a difference of 0.35%), Immigrants from Eritrea (4.8%, a difference of 0.47%), and Palestinian (4.8%, a difference of 0.48%).
| Demographics | Rating | Rank | Professional Degree |
| Albanians | 95.3 /100 | #120 | Exceptional 4.9% |
| Immigrants | Moldova | 94.8 /100 | #121 | Exceptional 4.9% |
| Immigrants | Germany | 94.1 /100 | #122 | Exceptional 4.9% |
| Immigrants | Venezuela | 93.8 /100 | #123 | Exceptional 4.8% |
| Immigrants | Eritrea | 93.5 /100 | #124 | Exceptional 4.8% |
| Immigrants | Albania | 93.3 /100 | #125 | Exceptional 4.8% |
| Europeans | 93.2 /100 | #126 | Exceptional 4.8% |
| Serbians | 92.6 /100 | #127 | Exceptional 4.8% |
| Immigrants | Eastern Africa | 92.5 /100 | #128 | Exceptional 4.8% |
| Palestinians | 91.5 /100 | #129 | Exceptional 4.8% |
| Icelanders | 91.5 /100 | #130 | Exceptional 4.8% |
| Immigrants | Nepal | 91.4 /100 | #131 | Exceptional 4.8% |
| Pakistanis | 90.9 /100 | #132 | Exceptional 4.8% |
| Italians | 90.2 /100 | #133 | Exceptional 4.8% |
| South American Indians | 89.9 /100 | #134 | Excellent 4.8% |
Demographics Similar to Guamanians/Chamorros by Professional Degree
In terms of professional degree, the demographic groups most similar to Guamanians/Chamorros are Alaskan Athabascan (3.8%, a difference of 0.080%), Native Hawaiian (3.8%, a difference of 0.080%), Immigrants from Ecuador (3.8%, a difference of 0.10%), British West Indian (3.8%, a difference of 0.33%), and Immigrants from Bahamas (3.8%, a difference of 0.43%).
| Demographics | Rating | Rank | Professional Degree |
| Spanish Americans | 3.8 /100 | #236 | Tragic 3.9% |
| Immigrants | Trinidad and Tobago | 3.8 /100 | #237 | Tragic 3.9% |
| Colville | 2.6 /100 | #238 | Tragic 3.8% |
| British West Indians | 2.4 /100 | #239 | Tragic 3.8% |
| Immigrants | Ecuador | 2.3 /100 | #240 | Tragic 3.8% |
| Alaskan Athabascans | 2.3 /100 | #241 | Tragic 3.8% |
| Native Hawaiians | 2.3 /100 | #242 | Tragic 3.8% |
| Guamanians/Chamorros | 2.2 /100 | #243 | Tragic 3.8% |
| Immigrants | Bahamas | 2.0 /100 | #244 | Tragic 3.8% |
| French American Indians | 1.7 /100 | #245 | Tragic 3.8% |
| Marshallese | 1.7 /100 | #246 | Tragic 3.8% |
| Guyanese | 1.6 /100 | #247 | Tragic 3.8% |
| Hmong | 1.6 /100 | #248 | Tragic 3.7% |
| Immigrants | Grenada | 1.5 /100 | #249 | Tragic 3.7% |
| Immigrants | Fiji | 1.5 /100 | #250 | Tragic 3.7% |