Immigrants from Oceania vs Hispanic or Latino College, Under 1 year
COMPARE
Immigrants from Oceania
Hispanic or Latino
College, Under 1 year
College, Under 1 year Comparison
Immigrants from Oceania
Hispanics or Latinos
65.6%
COLLEGE, UNDER 1 YEAR
55.0/ 100
METRIC RATING
171st/ 347
METRIC RANK
57.0%
COLLEGE, UNDER 1 YEAR
0.0/ 100
METRIC RATING
317th/ 347
METRIC RANK
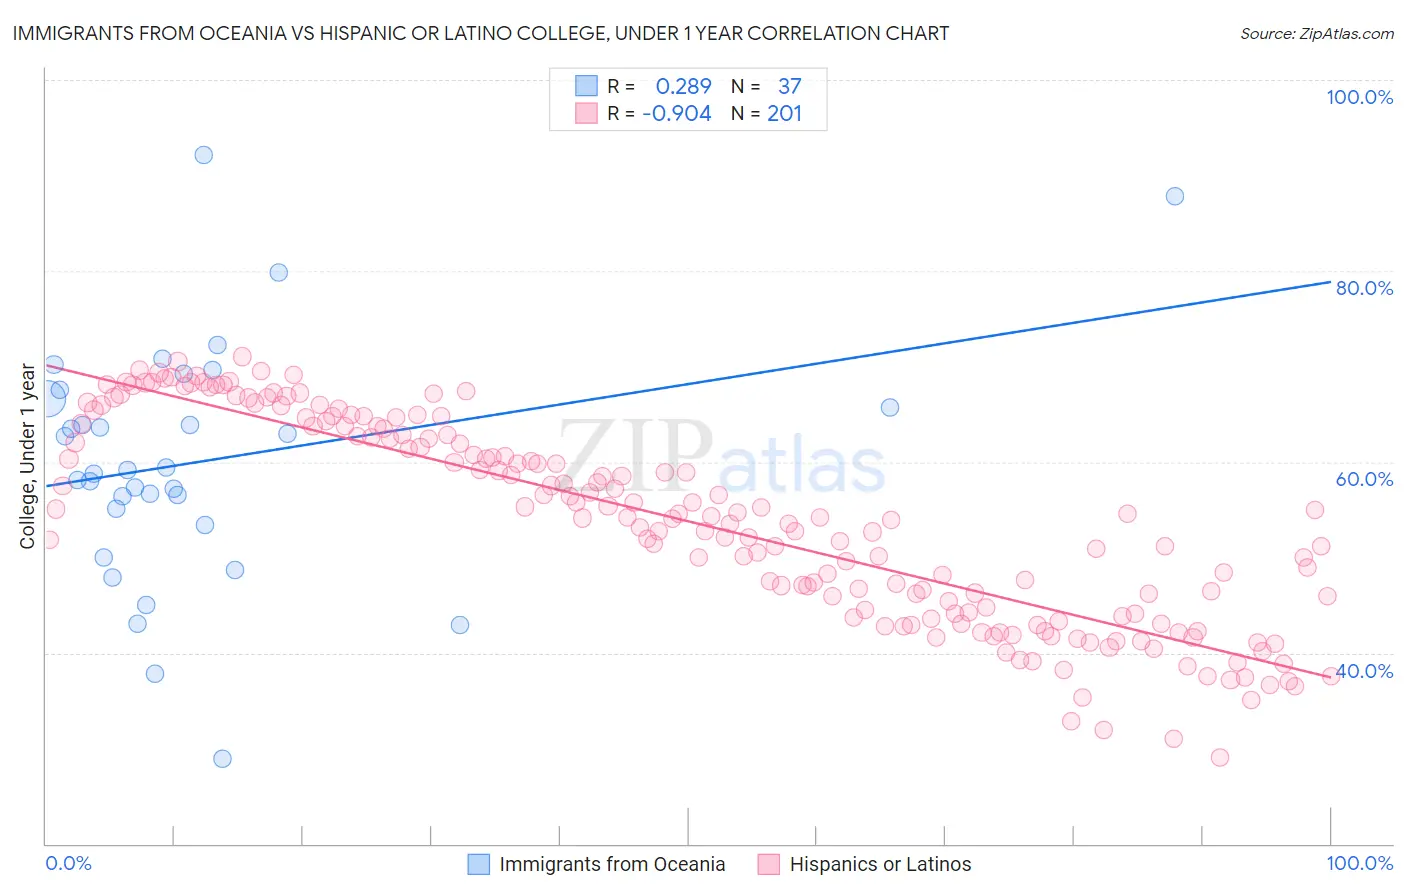
Immigrants from Oceania vs Hispanic or Latino College, Under 1 year Correlation Chart
The statistical analysis conducted on geographies consisting of 305,519,500 people shows a weak positive correlation between the proportion of Immigrants from Oceania and percentage of population with at least college, under 1 year education in the United States with a correlation coefficient (R) of 0.289 and weighted average of 65.6%. Similarly, the statistical analysis conducted on geographies consisting of 578,595,027 people shows a near-perfect negative correlation between the proportion of Hispanics or Latinos and percentage of population with at least college, under 1 year education in the United States with a correlation coefficient (R) of -0.904 and weighted average of 57.0%, a difference of 15.0%.
College, Under 1 year Correlation Summary
| Measurement | Immigrants from Oceania | Hispanic or Latino |
| Minimum | 28.9% | 29.0% |
| Maximum | 92.2% | 71.0% |
| Range | 63.2% | 42.1% |
| Mean | 60.1% | 53.7% |
| Median | 59.2% | 54.2% |
| Interquartile 25% (IQ1) | 54.3% | 44.1% |
| Interquartile 75% (IQ3) | 67.1% | 63.6% |
| Interquartile Range (IQR) | 12.8% | 19.5% |
| Standard Deviation (Sample) | 12.6% | 10.5% |
| Standard Deviation (Population) | 12.4% | 10.5% |
Similar Demographics by College, Under 1 year
Demographics Similar to Immigrants from Oceania by College, Under 1 year
In terms of college, under 1 year, the demographic groups most similar to Immigrants from Oceania are Yugoslavian (65.6%, a difference of 0.030%), German (65.6%, a difference of 0.030%), South American Indian (65.5%, a difference of 0.030%), Hungarian (65.6%, a difference of 0.040%), and Swiss (65.5%, a difference of 0.050%).
| Demographics | Rating | Rank | College, Under 1 year |
| Czechoslovakians | 62.6 /100 | #164 | Good 65.8% |
| Immigrants | Uzbekistan | 61.6 /100 | #165 | Good 65.8% |
| Moroccans | 56.7 /100 | #166 | Average 65.6% |
| Immigrants | Somalia | 56.4 /100 | #167 | Average 65.6% |
| Hungarians | 55.9 /100 | #168 | Average 65.6% |
| Yugoslavians | 55.7 /100 | #169 | Average 65.6% |
| Germans | 55.7 /100 | #170 | Average 65.6% |
| Immigrants | Oceania | 55.0 /100 | #171 | Average 65.6% |
| South American Indians | 54.4 /100 | #172 | Average 65.5% |
| Swiss | 53.9 /100 | #173 | Average 65.5% |
| Immigrants | Bosnia and Herzegovina | 50.0 /100 | #174 | Average 65.4% |
| Scotch-Irish | 49.5 /100 | #175 | Average 65.4% |
| French | 48.9 /100 | #176 | Average 65.4% |
| Immigrants | North Macedonia | 48.6 /100 | #177 | Average 65.4% |
| German Russians | 48.3 /100 | #178 | Average 65.4% |
Demographics Similar to Hispanics or Latinos by College, Under 1 year
In terms of college, under 1 year, the demographic groups most similar to Hispanics or Latinos are Menominee (57.0%, a difference of 0.040%), Honduran (57.1%, a difference of 0.090%), Immigrants from Haiti (56.9%, a difference of 0.12%), Hopi (57.1%, a difference of 0.14%), and Dutch West Indian (57.2%, a difference of 0.26%).
| Demographics | Rating | Rank | College, Under 1 year |
| Pueblo | 0.0 /100 | #310 | Tragic 57.4% |
| Cajuns | 0.0 /100 | #311 | Tragic 57.3% |
| Salvadorans | 0.0 /100 | #312 | Tragic 57.3% |
| Dutch West Indians | 0.0 /100 | #313 | Tragic 57.2% |
| Hopi | 0.0 /100 | #314 | Tragic 57.1% |
| Hondurans | 0.0 /100 | #315 | Tragic 57.1% |
| Menominee | 0.0 /100 | #316 | Tragic 57.0% |
| Hispanics or Latinos | 0.0 /100 | #317 | Tragic 57.0% |
| Immigrants | Haiti | 0.0 /100 | #318 | Tragic 56.9% |
| Puerto Ricans | 0.0 /100 | #319 | Tragic 56.8% |
| Guatemalans | 0.0 /100 | #320 | Tragic 56.8% |
| Natives/Alaskans | 0.0 /100 | #321 | Tragic 56.6% |
| Immigrants | Caribbean | 0.0 /100 | #322 | Tragic 56.6% |
| Immigrants | Honduras | 0.0 /100 | #323 | Tragic 56.5% |
| Immigrants | El Salvador | 0.0 /100 | #324 | Tragic 56.4% |