Senegalese vs Guatemalan 5th Grade
COMPARE
Senegalese
Guatemalan
5th Grade
5th Grade Comparison
Senegalese
Guatemalans
97.0%
5TH GRADE
2.8/ 100
METRIC RATING
236th/ 347
METRIC RANK
94.8%
5TH GRADE
0.0/ 100
METRIC RATING
340th/ 347
METRIC RANK
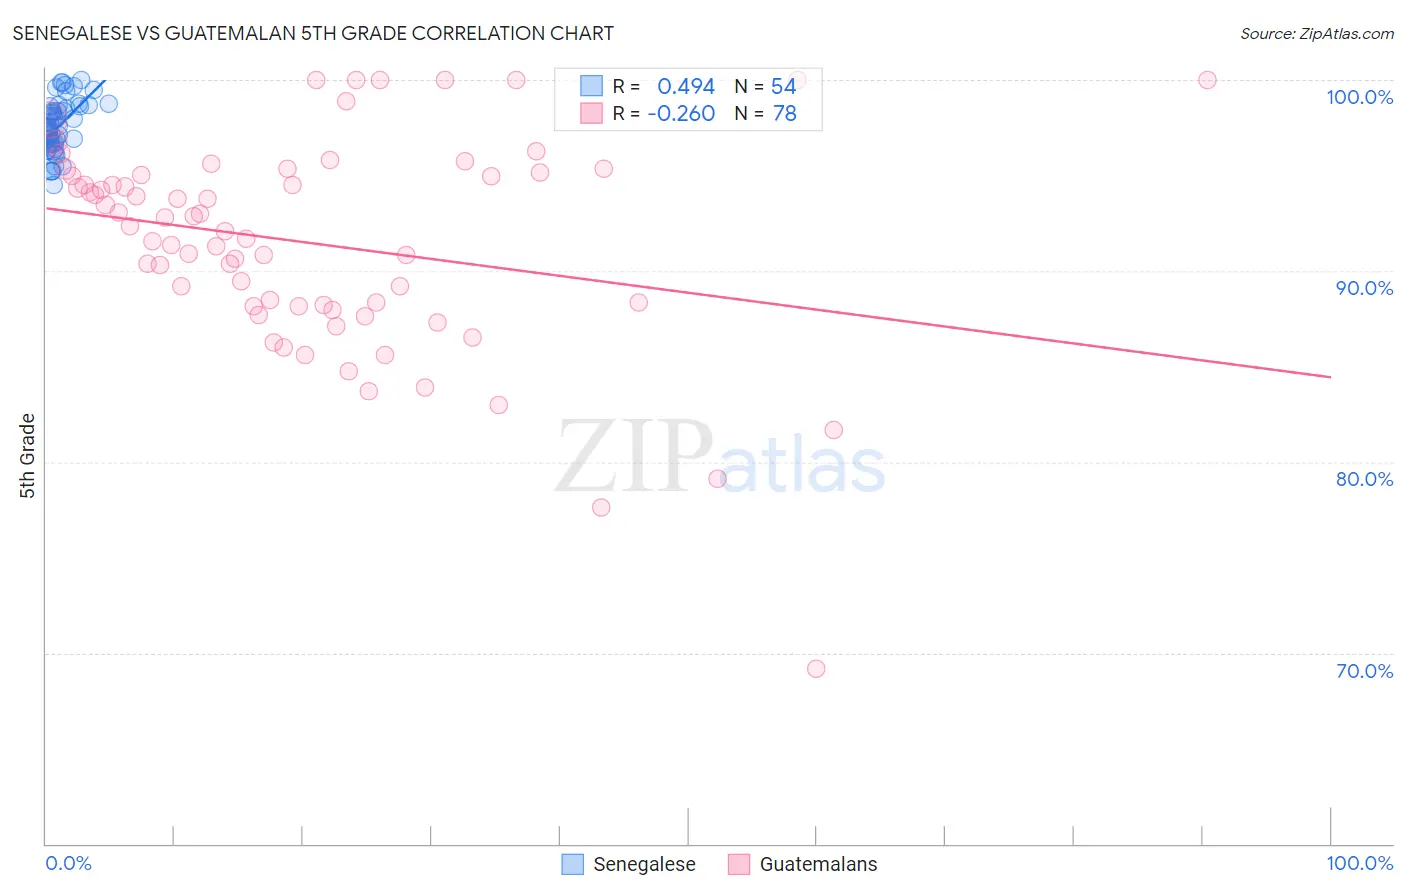
Senegalese vs Guatemalan 5th Grade Correlation Chart
The statistical analysis conducted on geographies consisting of 78,142,569 people shows a moderate positive correlation between the proportion of Senegalese and percentage of population with at least 5th grade education in the United States with a correlation coefficient (R) of 0.494 and weighted average of 97.0%. Similarly, the statistical analysis conducted on geographies consisting of 409,566,469 people shows a weak negative correlation between the proportion of Guatemalans and percentage of population with at least 5th grade education in the United States with a correlation coefficient (R) of -0.260 and weighted average of 94.8%, a difference of 2.2%.
5th Grade Correlation Summary
| Measurement | Senegalese | Guatemalan |
| Minimum | 94.5% | 69.2% |
| Maximum | 100.0% | 100.0% |
| Range | 5.5% | 30.8% |
| Mean | 97.6% | 91.5% |
| Median | 97.5% | 92.2% |
| Interquartile 25% (IQ1) | 96.7% | 88.2% |
| Interquartile 75% (IQ3) | 98.6% | 95.0% |
| Interquartile Range (IQR) | 1.9% | 6.8% |
| Standard Deviation (Sample) | 1.4% | 5.6% |
| Standard Deviation (Population) | 1.4% | 5.6% |
Similar Demographics by 5th Grade
Demographics Similar to Senegalese by 5th Grade
In terms of 5th grade, the demographic groups most similar to Senegalese are Subsaharan African (97.0%, a difference of 0.020%), Tohono O'odham (97.0%, a difference of 0.020%), Uruguayan (97.0%, a difference of 0.020%), Immigrants from Indonesia (96.9%, a difference of 0.030%), and Asian (96.9%, a difference of 0.030%).
| Demographics | Rating | Rank | 5th Grade |
| Yuman | 4.5 /100 | #229 | Tragic 97.0% |
| Immigrants | Western Asia | 4.3 /100 | #230 | Tragic 97.0% |
| Immigrants | Malaysia | 4.1 /100 | #231 | Tragic 97.0% |
| Immigrants | Eastern Asia | 4.0 /100 | #232 | Tragic 97.0% |
| Sub-Saharan Africans | 3.3 /100 | #233 | Tragic 97.0% |
| Tohono O'odham | 3.2 /100 | #234 | Tragic 97.0% |
| Uruguayans | 3.2 /100 | #235 | Tragic 97.0% |
| Senegalese | 2.8 /100 | #236 | Tragic 97.0% |
| Immigrants | Indonesia | 2.0 /100 | #237 | Tragic 96.9% |
| Asians | 2.0 /100 | #238 | Tragic 96.9% |
| Nigerians | 1.9 /100 | #239 | Tragic 96.9% |
| Indians (Asian) | 1.9 /100 | #240 | Tragic 96.9% |
| Immigrants | Asia | 1.7 /100 | #241 | Tragic 96.9% |
| Immigrants | Costa Rica | 1.6 /100 | #242 | Tragic 96.9% |
| Immigrants | Eastern Africa | 1.6 /100 | #243 | Tragic 96.9% |
Demographics Similar to Guatemalans by 5th Grade
In terms of 5th grade, the demographic groups most similar to Guatemalans are Immigrants from Yemen (94.9%, a difference of 0.030%), Immigrants from Cabo Verde (94.9%, a difference of 0.070%), Yakama (94.8%, a difference of 0.080%), Immigrants from Central America (94.7%, a difference of 0.18%), and Central American (95.1%, a difference of 0.23%).
| Demographics | Rating | Rank | 5th Grade |
| Immigrants | Latin America | 0.0 /100 | #333 | Tragic 95.3% |
| Nepalese | 0.0 /100 | #334 | Tragic 95.2% |
| Mexicans | 0.0 /100 | #335 | Tragic 95.2% |
| Immigrants | Azores | 0.0 /100 | #336 | Tragic 95.1% |
| Central Americans | 0.0 /100 | #337 | Tragic 95.1% |
| Immigrants | Cabo Verde | 0.0 /100 | #338 | Tragic 94.9% |
| Immigrants | Yemen | 0.0 /100 | #339 | Tragic 94.9% |
| Guatemalans | 0.0 /100 | #340 | Tragic 94.8% |
| Yakama | 0.0 /100 | #341 | Tragic 94.8% |
| Immigrants | Central America | 0.0 /100 | #342 | Tragic 94.7% |
| Salvadorans | 0.0 /100 | #343 | Tragic 94.6% |
| Immigrants | Mexico | 0.0 /100 | #344 | Tragic 94.6% |
| Immigrants | Guatemala | 0.0 /100 | #345 | Tragic 94.6% |
| Immigrants | El Salvador | 0.0 /100 | #346 | Tragic 94.3% |
| Spanish American Indians | 0.0 /100 | #347 | Tragic 94.2% |