Norwegian vs Sudanese 5th Grade
COMPARE
Norwegian
Sudanese
5th Grade
5th Grade Comparison
Norwegians
Sudanese
98.4%
5TH GRADE
100.0/ 100
METRIC RATING
3rd/ 347
METRIC RANK
97.1%
5TH GRADE
7.0/ 100
METRIC RATING
216th/ 347
METRIC RANK
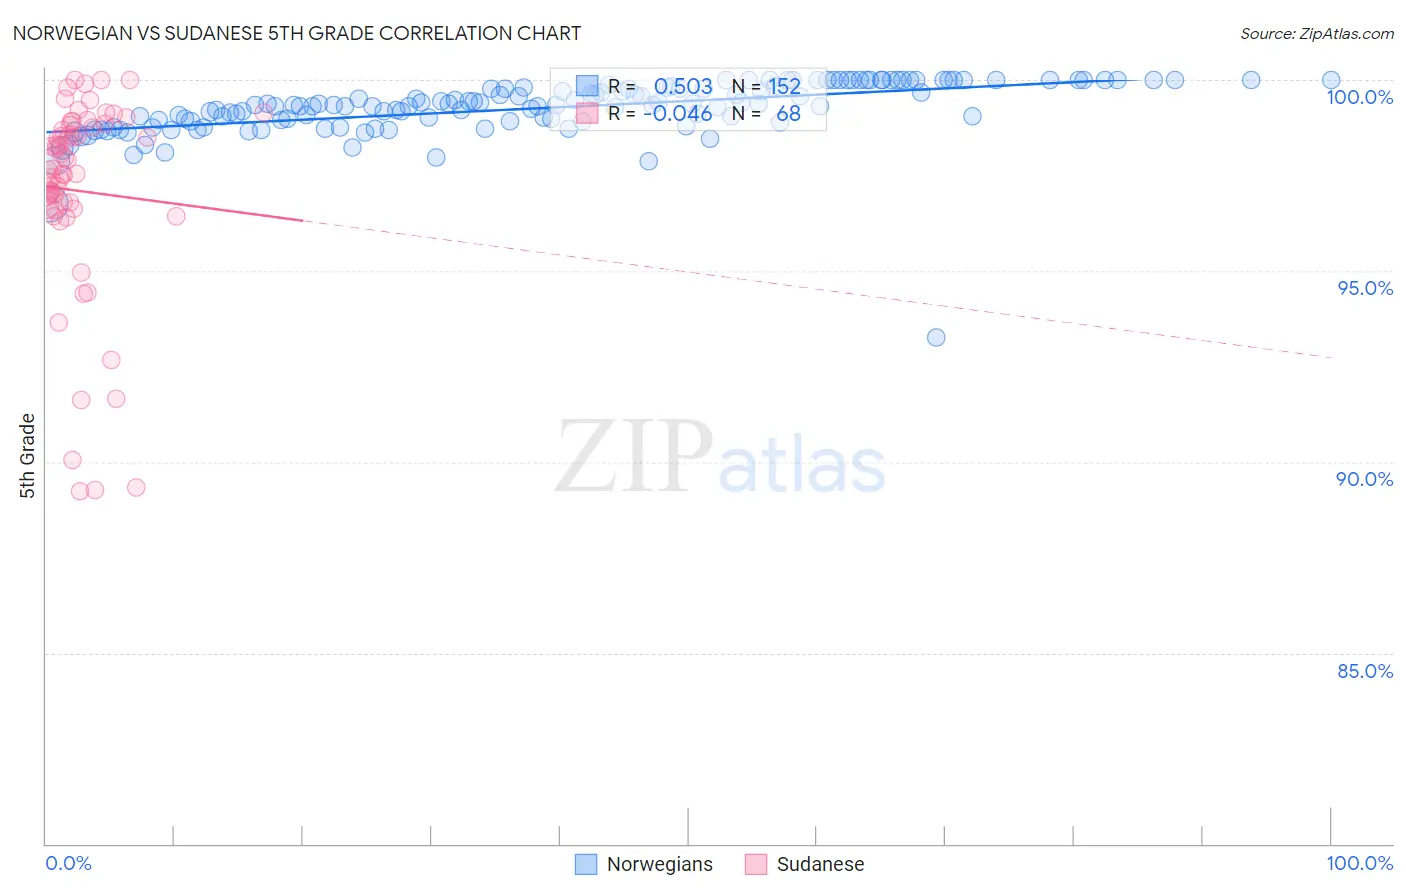
Norwegian vs Sudanese 5th Grade Correlation Chart
The statistical analysis conducted on geographies consisting of 533,395,488 people shows a substantial positive correlation between the proportion of Norwegians and percentage of population with at least 5th grade education in the United States with a correlation coefficient (R) of 0.503 and weighted average of 98.4%. Similarly, the statistical analysis conducted on geographies consisting of 110,147,806 people shows no correlation between the proportion of Sudanese and percentage of population with at least 5th grade education in the United States with a correlation coefficient (R) of -0.046 and weighted average of 97.1%, a difference of 1.4%.
5th Grade Correlation Summary
| Measurement | Norwegian | Sudanese |
| Minimum | 93.2% | 89.2% |
| Maximum | 100.0% | 100.0% |
| Range | 6.8% | 10.8% |
| Mean | 99.3% | 97.1% |
| Median | 99.3% | 97.7% |
| Interquartile 25% (IQ1) | 98.9% | 96.6% |
| Interquartile 75% (IQ3) | 99.8% | 98.8% |
| Interquartile Range (IQR) | 0.91% | 2.1% |
| Standard Deviation (Sample) | 0.77% | 2.6% |
| Standard Deviation (Population) | 0.76% | 2.6% |
Similar Demographics by 5th Grade
Demographics Similar to Norwegians by 5th Grade
In terms of 5th grade, the demographic groups most similar to Norwegians are Tsimshian (98.4%, a difference of 0.0%), Slovak (98.4%, a difference of 0.020%), German (98.4%, a difference of 0.020%), Inupiat (98.4%, a difference of 0.050%), and Slovene (98.3%, a difference of 0.070%).
| Demographics | Rating | Rank | 5th Grade |
| Crow | 100.0 /100 | #1 | Exceptional 99.5% |
| Welsh | 100.0 /100 | #2 | Exceptional 98.6% |
| Norwegians | 100.0 /100 | #3 | Exceptional 98.4% |
| Tsimshian | 100.0 /100 | #4 | Exceptional 98.4% |
| Slovaks | 100.0 /100 | #5 | Exceptional 98.4% |
| Germans | 100.0 /100 | #6 | Exceptional 98.4% |
| Inupiat | 100.0 /100 | #7 | Exceptional 98.4% |
| Slovenes | 100.0 /100 | #8 | Exceptional 98.3% |
| Swedes | 100.0 /100 | #9 | Exceptional 98.3% |
| English | 100.0 /100 | #10 | Exceptional 98.3% |
| Alaskan Athabascans | 100.0 /100 | #11 | Exceptional 98.3% |
| Carpatho Rusyns | 100.0 /100 | #12 | Exceptional 98.3% |
| Tlingit-Haida | 100.0 /100 | #13 | Exceptional 98.3% |
| Dutch | 100.0 /100 | #14 | Exceptional 98.3% |
| Scottish | 100.0 /100 | #15 | Exceptional 98.3% |
Demographics Similar to Sudanese by 5th Grade
In terms of 5th grade, the demographic groups most similar to Sudanese are Immigrants from Lebanon (97.1%, a difference of 0.0%), Portuguese (97.1%, a difference of 0.010%), Costa Rican (97.1%, a difference of 0.010%), Immigrants from Morocco (97.1%, a difference of 0.010%), and Immigrants from Sudan (97.1%, a difference of 0.010%).
| Demographics | Rating | Rank | 5th Grade |
| Immigrants | Nepal | 10.3 /100 | #209 | Poor 97.1% |
| Immigrants | Oceania | 10.0 /100 | #210 | Poor 97.1% |
| Samoans | 8.5 /100 | #211 | Tragic 97.1% |
| Immigrants | Iraq | 8.3 /100 | #212 | Tragic 97.1% |
| Portuguese | 7.8 /100 | #213 | Tragic 97.1% |
| Costa Ricans | 7.7 /100 | #214 | Tragic 97.1% |
| Immigrants | Morocco | 7.5 /100 | #215 | Tragic 97.1% |
| Sudanese | 7.0 /100 | #216 | Tragic 97.1% |
| Immigrants | Lebanon | 6.8 /100 | #217 | Tragic 97.1% |
| Immigrants | Sudan | 6.5 /100 | #218 | Tragic 97.1% |
| Immigrants | Syria | 6.4 /100 | #219 | Tragic 97.1% |
| Immigrants | Southern Europe | 6.3 /100 | #220 | Tragic 97.1% |
| Sierra Leoneans | 6.0 /100 | #221 | Tragic 97.1% |
| Immigrants | Panama | 5.7 /100 | #222 | Tragic 97.0% |
| Liberians | 5.7 /100 | #223 | Tragic 97.0% |