Hawaiian vs Sudanese 5th Grade
COMPARE
Hawaiian
Sudanese
5th Grade
5th Grade Comparison
Hawaiians
Sudanese
97.2%
5TH GRADE
25.6/ 100
METRIC RATING
196th/ 347
METRIC RANK
97.1%
5TH GRADE
7.0/ 100
METRIC RATING
216th/ 347
METRIC RANK
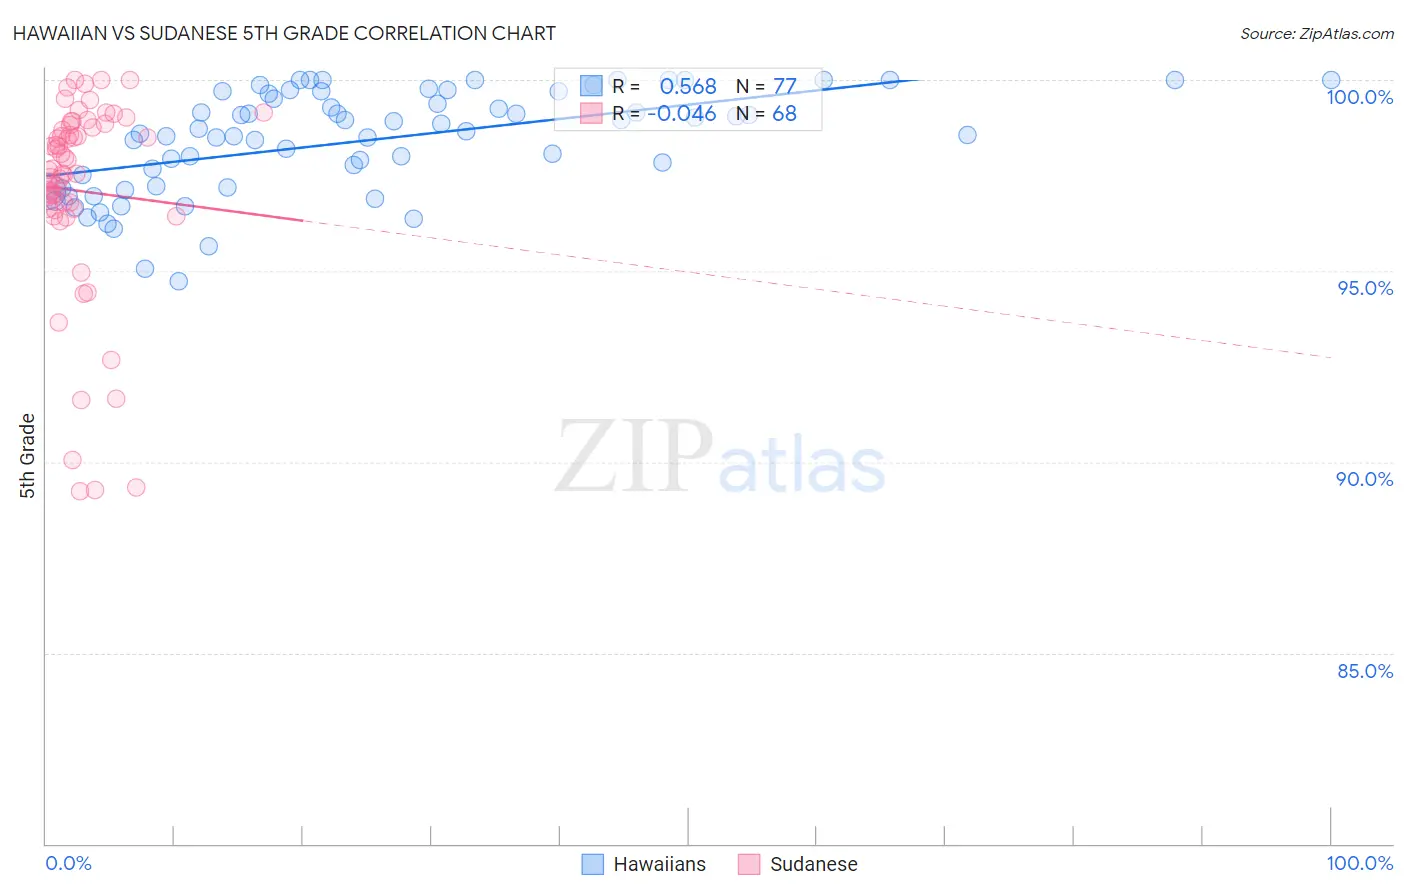
Hawaiian vs Sudanese 5th Grade Correlation Chart
The statistical analysis conducted on geographies consisting of 327,621,279 people shows a substantial positive correlation between the proportion of Hawaiians and percentage of population with at least 5th grade education in the United States with a correlation coefficient (R) of 0.568 and weighted average of 97.2%. Similarly, the statistical analysis conducted on geographies consisting of 110,147,806 people shows no correlation between the proportion of Sudanese and percentage of population with at least 5th grade education in the United States with a correlation coefficient (R) of -0.046 and weighted average of 97.1%, a difference of 0.16%.
5th Grade Correlation Summary
| Measurement | Hawaiian | Sudanese |
| Minimum | 94.7% | 89.2% |
| Maximum | 100.0% | 100.0% |
| Range | 5.3% | 10.8% |
| Mean | 98.4% | 97.1% |
| Median | 98.7% | 97.7% |
| Interquartile 25% (IQ1) | 97.2% | 96.6% |
| Interquartile 75% (IQ3) | 99.7% | 98.8% |
| Interquartile Range (IQR) | 2.5% | 2.1% |
| Standard Deviation (Sample) | 1.3% | 2.6% |
| Standard Deviation (Population) | 1.3% | 2.6% |
Demographics Similar to Hawaiians and Sudanese by 5th Grade
In terms of 5th grade, the demographic groups most similar to Hawaiians are Brazilian (97.2%, a difference of 0.0%), Immigrants from Uganda (97.2%, a difference of 0.030%), Native/Alaskan (97.2%, a difference of 0.050%), Immigrants from Northern Africa (97.2%, a difference of 0.060%), and Immigrants from Chile (97.2%, a difference of 0.060%). Similarly, the demographic groups most similar to Sudanese are Portuguese (97.1%, a difference of 0.010%), Costa Rican (97.1%, a difference of 0.010%), Immigrants from Morocco (97.1%, a difference of 0.010%), Samoan (97.1%, a difference of 0.020%), and Immigrants from Iraq (97.1%, a difference of 0.020%).
| Demographics | Rating | Rank | 5th Grade |
| Hawaiians | 25.6 /100 | #196 | Fair 97.2% |
| Brazilians | 25.4 /100 | #197 | Fair 97.2% |
| Immigrants | Uganda | 21.1 /100 | #198 | Fair 97.2% |
| Natives/Alaskans | 18.0 /100 | #199 | Poor 97.2% |
| Immigrants | Northern Africa | 16.8 /100 | #200 | Poor 97.2% |
| Immigrants | Chile | 16.6 /100 | #201 | Poor 97.2% |
| Africans | 15.3 /100 | #202 | Poor 97.2% |
| Immigrants | Bahamas | 14.9 /100 | #203 | Poor 97.2% |
| Immigrants | Zaire | 13.7 /100 | #204 | Poor 97.1% |
| Moroccans | 12.0 /100 | #205 | Poor 97.1% |
| Paiute | 11.6 /100 | #206 | Poor 97.1% |
| Iraqis | 10.9 /100 | #207 | Poor 97.1% |
| Laotians | 10.8 /100 | #208 | Poor 97.1% |
| Immigrants | Nepal | 10.3 /100 | #209 | Poor 97.1% |
| Immigrants | Oceania | 10.0 /100 | #210 | Poor 97.1% |
| Samoans | 8.5 /100 | #211 | Tragic 97.1% |
| Immigrants | Iraq | 8.3 /100 | #212 | Tragic 97.1% |
| Portuguese | 7.8 /100 | #213 | Tragic 97.1% |
| Costa Ricans | 7.7 /100 | #214 | Tragic 97.1% |
| Immigrants | Morocco | 7.5 /100 | #215 | Tragic 97.1% |
| Sudanese | 7.0 /100 | #216 | Tragic 97.1% |