Senegalese vs Immigrants from Ecuador 5th Grade
COMPARE
Senegalese
Immigrants from Ecuador
5th Grade
5th Grade Comparison
Senegalese
Immigrants from Ecuador
97.0%
5TH GRADE
2.8/ 100
METRIC RATING
236th/ 347
METRIC RANK
95.8%
5TH GRADE
0.0/ 100
METRIC RATING
316th/ 347
METRIC RANK
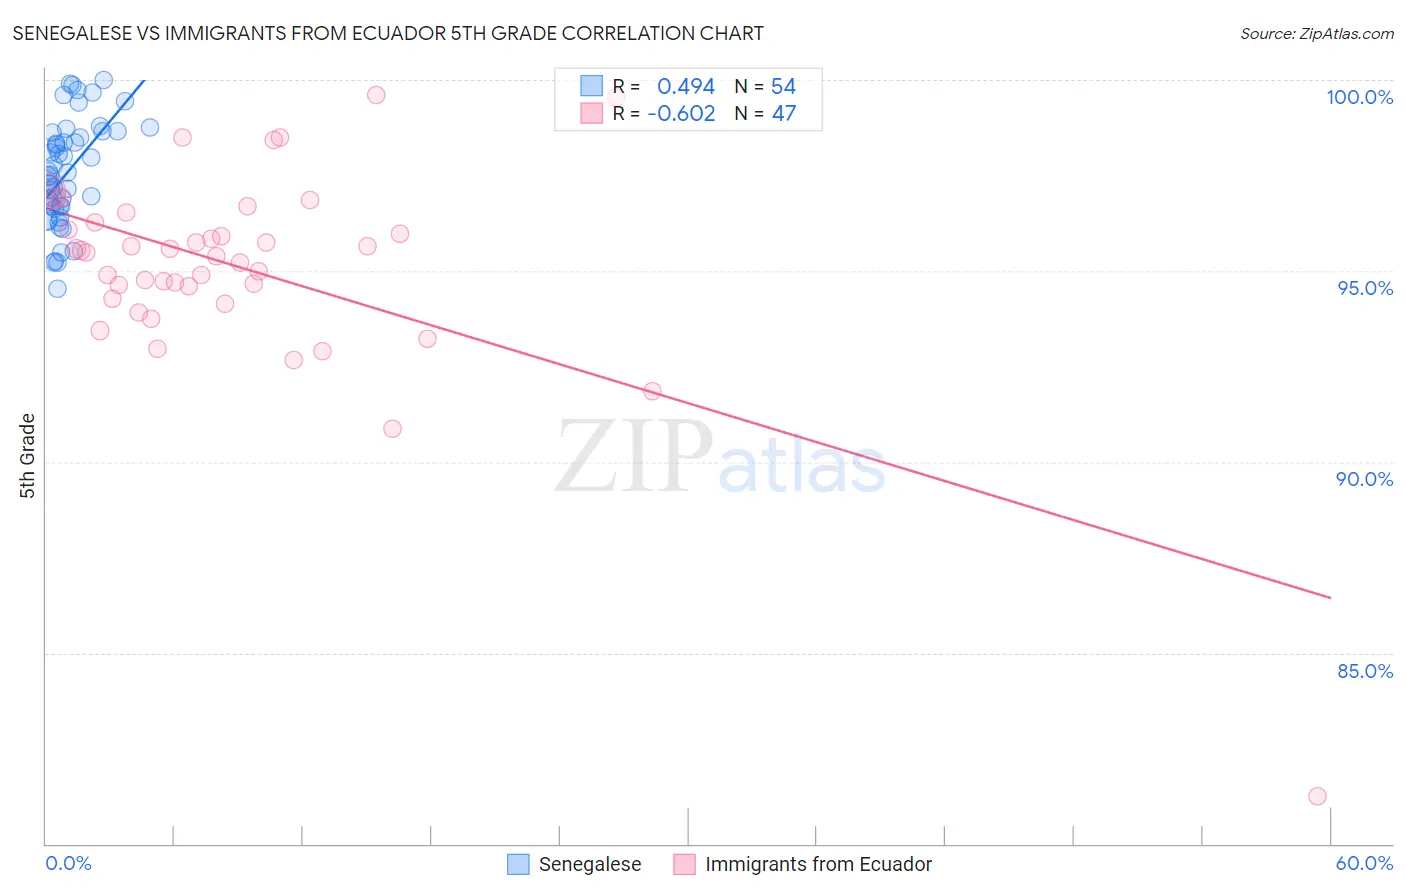
Senegalese vs Immigrants from Ecuador 5th Grade Correlation Chart
The statistical analysis conducted on geographies consisting of 78,142,569 people shows a moderate positive correlation between the proportion of Senegalese and percentage of population with at least 5th grade education in the United States with a correlation coefficient (R) of 0.494 and weighted average of 97.0%. Similarly, the statistical analysis conducted on geographies consisting of 271,020,679 people shows a significant negative correlation between the proportion of Immigrants from Ecuador and percentage of population with at least 5th grade education in the United States with a correlation coefficient (R) of -0.602 and weighted average of 95.8%, a difference of 1.2%.
5th Grade Correlation Summary
| Measurement | Senegalese | Immigrants from Ecuador |
| Minimum | 94.5% | 81.2% |
| Maximum | 100.0% | 99.6% |
| Range | 5.5% | 18.3% |
| Mean | 97.6% | 95.1% |
| Median | 97.5% | 95.5% |
| Interquartile 25% (IQ1) | 96.7% | 94.3% |
| Interquartile 75% (IQ3) | 98.6% | 96.3% |
| Interquartile Range (IQR) | 1.9% | 2.0% |
| Standard Deviation (Sample) | 1.4% | 2.7% |
| Standard Deviation (Population) | 1.4% | 2.7% |
Similar Demographics by 5th Grade
Demographics Similar to Senegalese by 5th Grade
In terms of 5th grade, the demographic groups most similar to Senegalese are Subsaharan African (97.0%, a difference of 0.020%), Tohono O'odham (97.0%, a difference of 0.020%), Uruguayan (97.0%, a difference of 0.020%), Immigrants from Indonesia (96.9%, a difference of 0.030%), and Asian (96.9%, a difference of 0.030%).
| Demographics | Rating | Rank | 5th Grade |
| Yuman | 4.5 /100 | #229 | Tragic 97.0% |
| Immigrants | Western Asia | 4.3 /100 | #230 | Tragic 97.0% |
| Immigrants | Malaysia | 4.1 /100 | #231 | Tragic 97.0% |
| Immigrants | Eastern Asia | 4.0 /100 | #232 | Tragic 97.0% |
| Sub-Saharan Africans | 3.3 /100 | #233 | Tragic 97.0% |
| Tohono O'odham | 3.2 /100 | #234 | Tragic 97.0% |
| Uruguayans | 3.2 /100 | #235 | Tragic 97.0% |
| Senegalese | 2.8 /100 | #236 | Tragic 97.0% |
| Immigrants | Indonesia | 2.0 /100 | #237 | Tragic 96.9% |
| Asians | 2.0 /100 | #238 | Tragic 96.9% |
| Nigerians | 1.9 /100 | #239 | Tragic 96.9% |
| Indians (Asian) | 1.9 /100 | #240 | Tragic 96.9% |
| Immigrants | Asia | 1.7 /100 | #241 | Tragic 96.9% |
| Immigrants | Costa Rica | 1.6 /100 | #242 | Tragic 96.9% |
| Immigrants | Eastern Africa | 1.6 /100 | #243 | Tragic 96.9% |
Demographics Similar to Immigrants from Ecuador by 5th Grade
In terms of 5th grade, the demographic groups most similar to Immigrants from Ecuador are Belizean (95.8%, a difference of 0.030%), Immigrants from Vietnam (95.8%, a difference of 0.050%), Nicaraguan (95.9%, a difference of 0.060%), Bangladeshi (95.9%, a difference of 0.080%), and Immigrants from Portugal (95.9%, a difference of 0.080%).
| Demographics | Rating | Rank | 5th Grade |
| Immigrants | Guyana | 0.0 /100 | #309 | Tragic 96.0% |
| Indonesians | 0.0 /100 | #310 | Tragic 96.0% |
| Immigrants | Bangladesh | 0.0 /100 | #311 | Tragic 96.0% |
| Vietnamese | 0.0 /100 | #312 | Tragic 95.9% |
| Bangladeshis | 0.0 /100 | #313 | Tragic 95.9% |
| Immigrants | Portugal | 0.0 /100 | #314 | Tragic 95.9% |
| Nicaraguans | 0.0 /100 | #315 | Tragic 95.9% |
| Immigrants | Ecuador | 0.0 /100 | #316 | Tragic 95.8% |
| Belizeans | 0.0 /100 | #317 | Tragic 95.8% |
| Immigrants | Vietnam | 0.0 /100 | #318 | Tragic 95.8% |
| Japanese | 0.0 /100 | #319 | Tragic 95.7% |
| Central American Indians | 0.0 /100 | #320 | Tragic 95.7% |
| Immigrants | Belize | 0.0 /100 | #321 | Tragic 95.7% |
| Immigrants | Nicaragua | 0.0 /100 | #322 | Tragic 95.6% |
| Immigrants | Fiji | 0.0 /100 | #323 | Tragic 95.6% |