Seminole vs Delaware Master's Degree
COMPARE
Seminole
Delaware
Master's Degree
Master's Degree Comparison
Seminole
Delaware
11.0%
MASTER'S DEGREE
0.0/ 100
METRIC RATING
311th/ 347
METRIC RANK
13.0%
MASTER'S DEGREE
1.7/ 100
METRIC RATING
244th/ 347
METRIC RANK
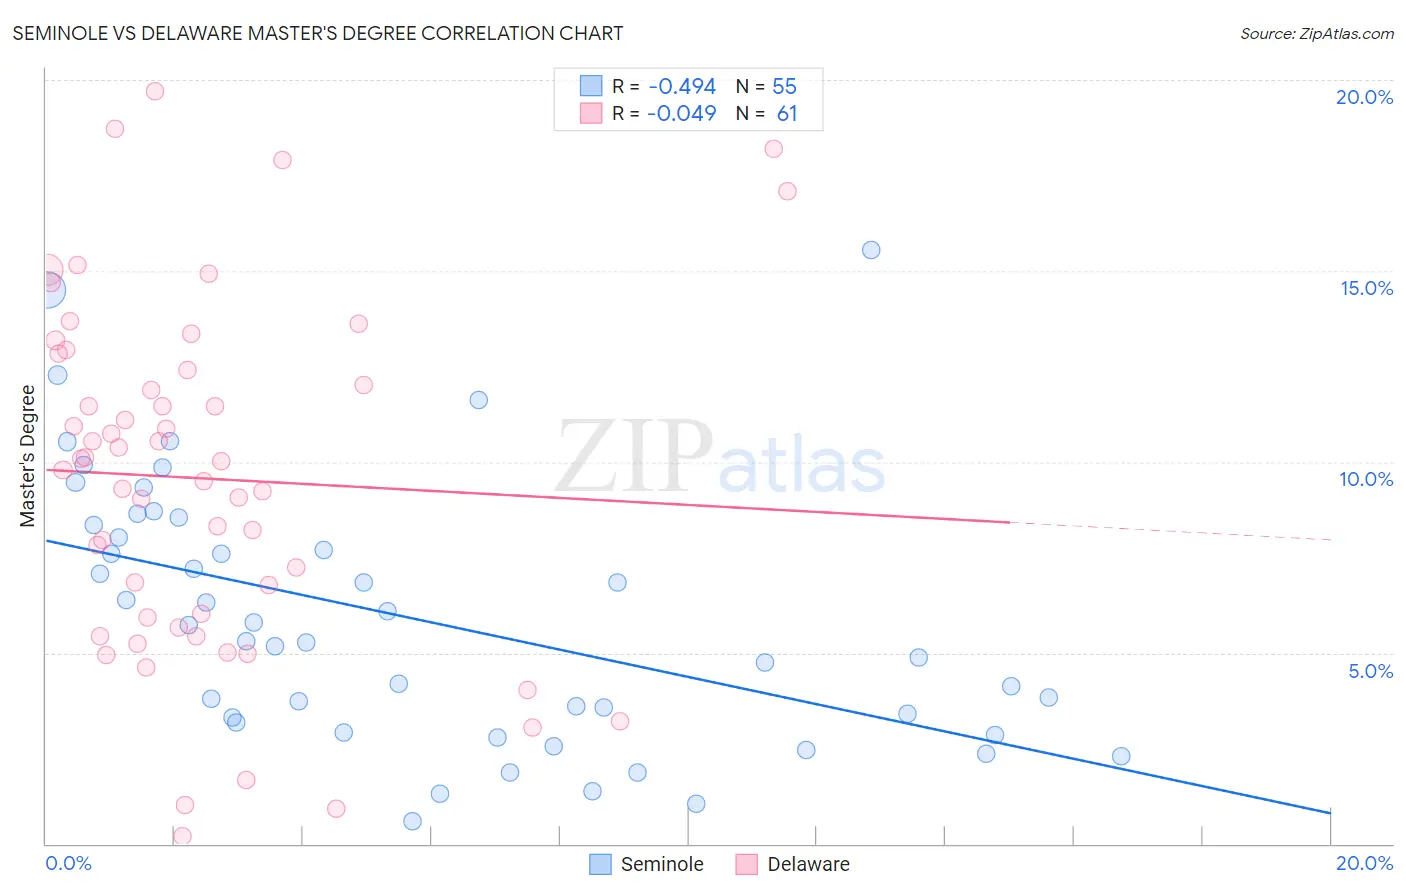
Seminole vs Delaware Master's Degree Correlation Chart
The statistical analysis conducted on geographies consisting of 118,305,652 people shows a moderate negative correlation between the proportion of Seminole and percentage of population with at least master's degree education in the United States with a correlation coefficient (R) of -0.494 and weighted average of 11.0%. Similarly, the statistical analysis conducted on geographies consisting of 96,222,112 people shows no correlation between the proportion of Delaware and percentage of population with at least master's degree education in the United States with a correlation coefficient (R) of -0.049 and weighted average of 13.0%, a difference of 17.6%.
Master's Degree Correlation Summary
| Measurement | Seminole | Delaware |
| Minimum | 0.60% | 0.20% |
| Maximum | 15.6% | 19.7% |
| Range | 15.0% | 19.5% |
| Mean | 5.9% | 9.6% |
| Median | 5.3% | 10.0% |
| Interquartile 25% (IQ1) | 3.2% | 5.8% |
| Interquartile 75% (IQ3) | 8.4% | 12.6% |
| Interquartile Range (IQR) | 5.2% | 6.8% |
| Standard Deviation (Sample) | 3.5% | 4.6% |
| Standard Deviation (Population) | 3.4% | 4.5% |
Similar Demographics by Master's Degree
Demographics Similar to Seminole by Master's Degree
In terms of master's degree, the demographic groups most similar to Seminole are Choctaw (11.0%, a difference of 0.10%), Yaqui (11.0%, a difference of 0.27%), Shoshone (11.1%, a difference of 0.51%), Cajun (11.0%, a difference of 0.67%), and Apache (11.0%, a difference of 0.67%).
| Demographics | Rating | Rank | Master's Degree |
| Immigrants | Cabo Verde | 0.1 /100 | #304 | Tragic 11.3% |
| Immigrants | Latin America | 0.0 /100 | #305 | Tragic 11.3% |
| Mexican American Indians | 0.0 /100 | #306 | Tragic 11.2% |
| Cheyenne | 0.0 /100 | #307 | Tragic 11.2% |
| Puerto Ricans | 0.0 /100 | #308 | Tragic 11.2% |
| Puget Sound Salish | 0.0 /100 | #309 | Tragic 11.1% |
| Shoshone | 0.0 /100 | #310 | Tragic 11.1% |
| Seminole | 0.0 /100 | #311 | Tragic 11.0% |
| Choctaw | 0.0 /100 | #312 | Tragic 11.0% |
| Yaqui | 0.0 /100 | #313 | Tragic 11.0% |
| Cajuns | 0.0 /100 | #314 | Tragic 11.0% |
| Apache | 0.0 /100 | #315 | Tragic 11.0% |
| Hispanics or Latinos | 0.0 /100 | #316 | Tragic 10.9% |
| Hopi | 0.0 /100 | #317 | Tragic 10.9% |
| Immigrants | Cuba | 0.0 /100 | #318 | Tragic 10.9% |
Demographics Similar to Delaware by Master's Degree
In terms of master's degree, the demographic groups most similar to Delaware are Immigrants from Jamaica (13.0%, a difference of 0.38%), Spanish American (13.0%, a difference of 0.42%), Immigrants from Bahamas (12.9%, a difference of 0.66%), U.S. Virgin Islander (13.1%, a difference of 0.70%), and Immigrants from Cambodia (12.9%, a difference of 0.70%).
| Demographics | Rating | Rank | Master's Degree |
| Jamaicans | 4.1 /100 | #237 | Tragic 13.4% |
| Hmong | 4.0 /100 | #238 | Tragic 13.4% |
| Immigrants | Nonimmigrants | 3.4 /100 | #239 | Tragic 13.3% |
| Guamanians/Chamorros | 2.2 /100 | #240 | Tragic 13.1% |
| U.S. Virgin Islanders | 2.1 /100 | #241 | Tragic 13.1% |
| Spanish Americans | 1.9 /100 | #242 | Tragic 13.0% |
| Immigrants | Jamaica | 1.9 /100 | #243 | Tragic 13.0% |
| Delaware | 1.7 /100 | #244 | Tragic 13.0% |
| Immigrants | Bahamas | 1.4 /100 | #245 | Tragic 12.9% |
| Immigrants | Cambodia | 1.4 /100 | #246 | Tragic 12.9% |
| Iroquois | 1.4 /100 | #247 | Tragic 12.9% |
| Africans | 1.4 /100 | #248 | Tragic 12.9% |
| Cree | 1.3 /100 | #249 | Tragic 12.8% |
| Liberians | 1.3 /100 | #250 | Tragic 12.8% |
| Tlingit-Haida | 1.3 /100 | #251 | Tragic 12.8% |