Seminole vs Immigrants from Barbados Associate's Degree
COMPARE
Seminole
Immigrants from Barbados
Associate's Degree
Associate's Degree Comparison
Seminole
Immigrants from Barbados
37.7%
ASSOCIATE'S DEGREE
0.0/ 100
METRIC RATING
314th/ 347
METRIC RANK
43.3%
ASSOCIATE'S DEGREE
2.9/ 100
METRIC RATING
230th/ 347
METRIC RANK
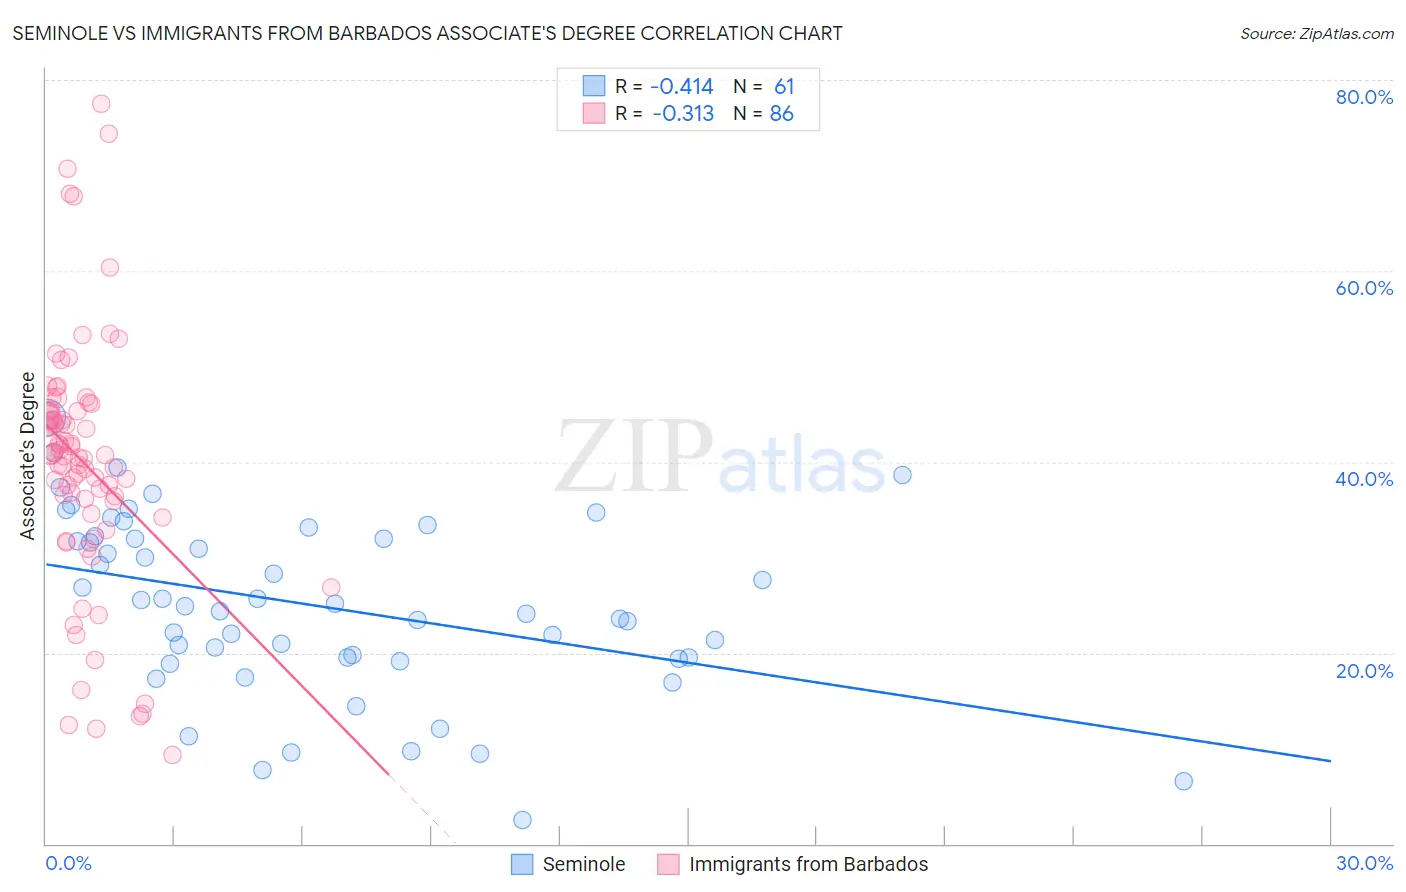
Seminole vs Immigrants from Barbados Associate's Degree Correlation Chart
The statistical analysis conducted on geographies consisting of 118,312,703 people shows a moderate negative correlation between the proportion of Seminole and percentage of population with at least associate's degree education in the United States with a correlation coefficient (R) of -0.414 and weighted average of 37.7%. Similarly, the statistical analysis conducted on geographies consisting of 112,783,541 people shows a mild negative correlation between the proportion of Immigrants from Barbados and percentage of population with at least associate's degree education in the United States with a correlation coefficient (R) of -0.313 and weighted average of 43.3%, a difference of 14.9%.
Associate's Degree Correlation Summary
| Measurement | Seminole | Immigrants from Barbados |
| Minimum | 2.5% | 9.3% |
| Maximum | 44.7% | 77.4% |
| Range | 42.2% | 68.2% |
| Mean | 24.9% | 40.0% |
| Median | 24.9% | 40.7% |
| Interquartile 25% (IQ1) | 19.4% | 35.9% |
| Interquartile 75% (IQ3) | 32.1% | 45.3% |
| Interquartile Range (IQR) | 12.6% | 9.5% |
| Standard Deviation (Sample) | 9.3% | 13.1% |
| Standard Deviation (Population) | 9.2% | 13.0% |
Similar Demographics by Associate's Degree
Demographics Similar to Seminole by Associate's Degree
In terms of associate's degree, the demographic groups most similar to Seminole are Hispanic or Latino (37.7%, a difference of 0.050%), Choctaw (37.8%, a difference of 0.20%), Creek (37.6%, a difference of 0.39%), Crow (37.6%, a difference of 0.40%), and Yaqui (37.6%, a difference of 0.41%).
| Demographics | Rating | Rank | Associate's Degree |
| Immigrants | El Salvador | 0.0 /100 | #307 | Tragic 38.4% |
| Mexican American Indians | 0.0 /100 | #308 | Tragic 38.2% |
| Immigrants | Guatemala | 0.0 /100 | #309 | Tragic 38.1% |
| Immigrants | Dominican Republic | 0.0 /100 | #310 | Tragic 37.9% |
| Immigrants | Latin America | 0.0 /100 | #311 | Tragic 37.9% |
| Choctaw | 0.0 /100 | #312 | Tragic 37.8% |
| Hispanics or Latinos | 0.0 /100 | #313 | Tragic 37.7% |
| Seminole | 0.0 /100 | #314 | Tragic 37.7% |
| Creek | 0.0 /100 | #315 | Tragic 37.6% |
| Crow | 0.0 /100 | #316 | Tragic 37.6% |
| Yaqui | 0.0 /100 | #317 | Tragic 37.6% |
| Alaska Natives | 0.0 /100 | #318 | Tragic 37.5% |
| Fijians | 0.0 /100 | #319 | Tragic 37.4% |
| Cajuns | 0.0 /100 | #320 | Tragic 37.4% |
| Immigrants | Yemen | 0.0 /100 | #321 | Tragic 37.3% |
Demographics Similar to Immigrants from Barbados by Associate's Degree
In terms of associate's degree, the demographic groups most similar to Immigrants from Barbados are Liberian (43.3%, a difference of 0.010%), Immigrants from Trinidad and Tobago (43.3%, a difference of 0.070%), Hmong (43.4%, a difference of 0.23%), Native Hawaiian (43.1%, a difference of 0.43%), and Tongan (43.0%, a difference of 0.60%).
| Demographics | Rating | Rank | Associate's Degree |
| Sub-Saharan Africans | 5.5 /100 | #223 | Tragic 43.9% |
| West Indians | 5.2 /100 | #224 | Tragic 43.8% |
| Guamanians/Chamorros | 4.8 /100 | #225 | Tragic 43.8% |
| Immigrants | Burma/Myanmar | 4.3 /100 | #226 | Tragic 43.7% |
| Trinidadians and Tobagonians | 4.0 /100 | #227 | Tragic 43.6% |
| Hmong | 3.2 /100 | #228 | Tragic 43.4% |
| Immigrants | Trinidad and Tobago | 3.0 /100 | #229 | Tragic 43.3% |
| Immigrants | Barbados | 2.9 /100 | #230 | Tragic 43.3% |
| Liberians | 2.9 /100 | #231 | Tragic 43.3% |
| Native Hawaiians | 2.3 /100 | #232 | Tragic 43.1% |
| Tongans | 2.2 /100 | #233 | Tragic 43.0% |
| Tlingit-Haida | 2.1 /100 | #234 | Tragic 43.0% |
| Ecuadorians | 2.0 /100 | #235 | Tragic 43.0% |
| Immigrants | St. Vincent and the Grenadines | 1.9 /100 | #236 | Tragic 42.9% |
| Immigrants | Nonimmigrants | 1.9 /100 | #237 | Tragic 42.9% |