Seminole vs Immigrants from Jordan 3rd Grade
COMPARE
Seminole
Immigrants from Jordan
3rd Grade
3rd Grade Comparison
Seminole
Immigrants from Jordan
97.9%
3RD GRADE
88.7/ 100
METRIC RATING
134th/ 347
METRIC RANK
97.8%
3RD GRADE
57.9/ 100
METRIC RATING
162nd/ 347
METRIC RANK
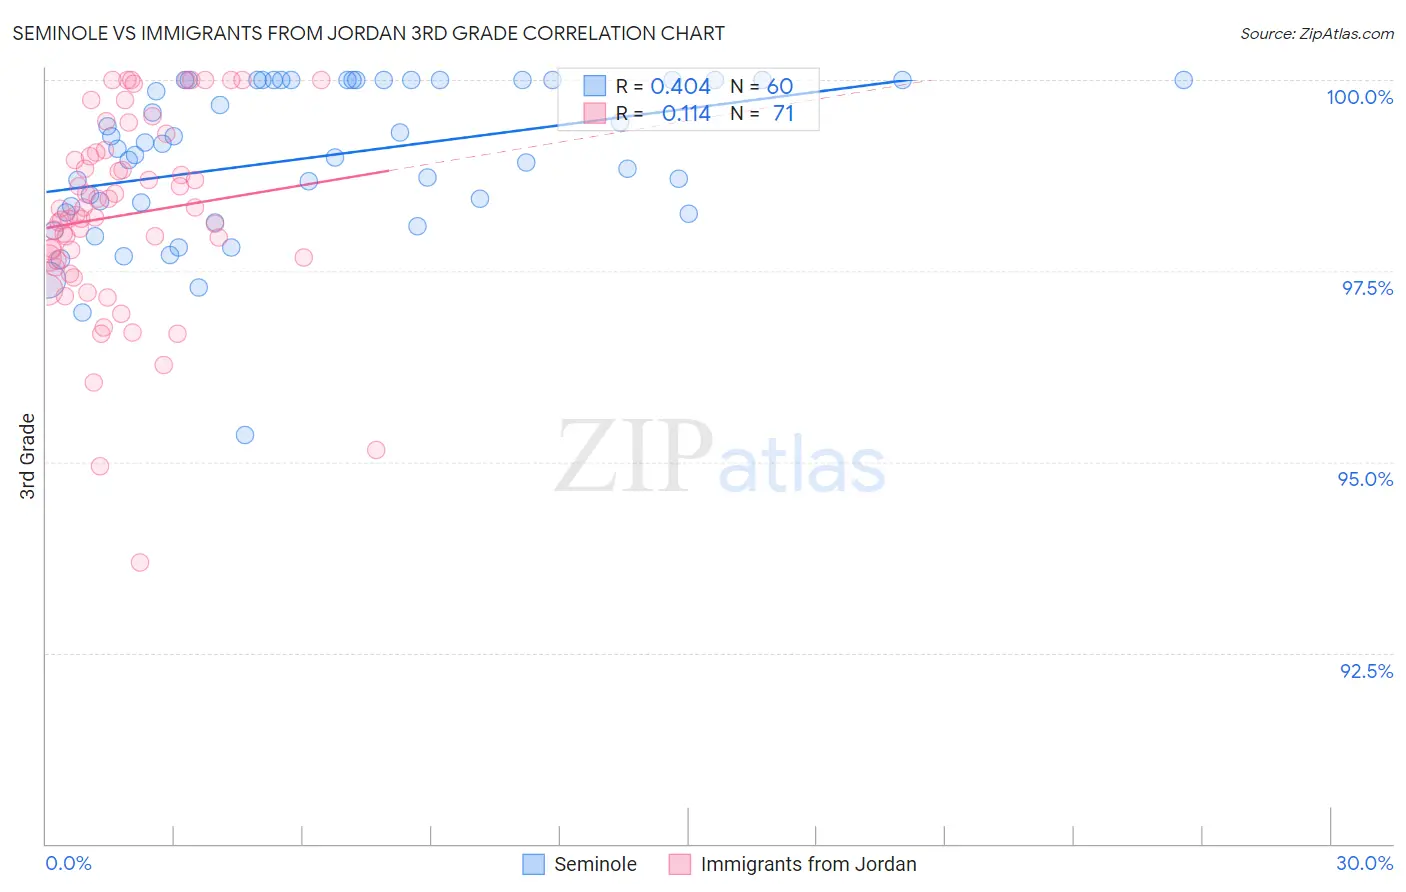
Seminole vs Immigrants from Jordan 3rd Grade Correlation Chart
The statistical analysis conducted on geographies consisting of 118,313,258 people shows a moderate positive correlation between the proportion of Seminole and percentage of population with at least 3rd grade education in the United States with a correlation coefficient (R) of 0.404 and weighted average of 97.9%. Similarly, the statistical analysis conducted on geographies consisting of 181,269,915 people shows a poor positive correlation between the proportion of Immigrants from Jordan and percentage of population with at least 3rd grade education in the United States with a correlation coefficient (R) of 0.114 and weighted average of 97.8%, a difference of 0.15%.
3rd Grade Correlation Summary
| Measurement | Seminole | Immigrants from Jordan |
| Minimum | 95.3% | 93.7% |
| Maximum | 100.0% | 100.0% |
| Range | 4.7% | 6.3% |
| Mean | 99.0% | 98.2% |
| Median | 99.1% | 98.2% |
| Interquartile 25% (IQ1) | 98.3% | 97.6% |
| Interquartile 75% (IQ3) | 100.0% | 99.1% |
| Interquartile Range (IQR) | 1.7% | 1.4% |
| Standard Deviation (Sample) | 1.0% | 1.3% |
| Standard Deviation (Population) | 1.0% | 1.3% |
Similar Demographics by 3rd Grade
Demographics Similar to Seminole by 3rd Grade
In terms of 3rd grade, the demographic groups most similar to Seminole are Immigrants from Bulgaria (97.9%, a difference of 0.0%), Immigrants from Hungary (97.9%, a difference of 0.0%), Immigrants from Kuwait (97.9%, a difference of 0.0%), Cambodian (97.9%, a difference of 0.0%), and Spaniard (97.9%, a difference of 0.010%).
| Demographics | Rating | Rank | 3rd Grade |
| Ute | 93.2 /100 | #127 | Exceptional 98.0% |
| Colville | 92.1 /100 | #128 | Exceptional 98.0% |
| Immigrants | Serbia | 91.9 /100 | #129 | Exceptional 98.0% |
| Immigrants | Europe | 91.2 /100 | #130 | Exceptional 98.0% |
| Immigrants | Bulgaria | 89.1 /100 | #131 | Excellent 97.9% |
| Immigrants | Hungary | 88.8 /100 | #132 | Excellent 97.9% |
| Immigrants | Kuwait | 88.7 /100 | #133 | Excellent 97.9% |
| Seminole | 88.7 /100 | #134 | Excellent 97.9% |
| Cambodians | 88.1 /100 | #135 | Excellent 97.9% |
| Spaniards | 87.9 /100 | #136 | Excellent 97.9% |
| Immigrants | Romania | 87.9 /100 | #137 | Excellent 97.9% |
| Israelis | 86.6 /100 | #138 | Excellent 97.9% |
| Blackfeet | 86.3 /100 | #139 | Excellent 97.9% |
| Palestinians | 84.6 /100 | #140 | Excellent 97.9% |
| Immigrants | Turkey | 83.5 /100 | #141 | Excellent 97.9% |
Demographics Similar to Immigrants from Jordan by 3rd Grade
In terms of 3rd grade, the demographic groups most similar to Immigrants from Jordan are Immigrants from Iran (97.8%, a difference of 0.0%), Albanian (97.8%, a difference of 0.0%), Marshallese (97.8%, a difference of 0.0%), Immigrants from Russia (97.8%, a difference of 0.010%), and Immigrants from Italy (97.8%, a difference of 0.010%).
| Demographics | Rating | Rank | 3rd Grade |
| Bermudans | 62.6 /100 | #155 | Good 97.8% |
| Immigrants | Russia | 61.7 /100 | #156 | Good 97.8% |
| Immigrants | Italy | 61.2 /100 | #157 | Good 97.8% |
| Venezuelans | 60.9 /100 | #158 | Good 97.8% |
| French American Indians | 60.0 /100 | #159 | Average 97.8% |
| Immigrants | Iran | 59.1 /100 | #160 | Average 97.8% |
| Albanians | 58.8 /100 | #161 | Average 97.8% |
| Immigrants | Jordan | 57.9 /100 | #162 | Average 97.8% |
| Marshallese | 57.2 /100 | #163 | Average 97.8% |
| Immigrants | Bosnia and Herzegovina | 56.2 /100 | #164 | Average 97.8% |
| Ugandans | 56.1 /100 | #165 | Average 97.8% |
| Dutch West Indians | 55.5 /100 | #166 | Average 97.8% |
| Chileans | 55.3 /100 | #167 | Average 97.8% |
| Immigrants | Spain | 54.3 /100 | #168 | Average 97.8% |
| Comanche | 53.8 /100 | #169 | Average 97.8% |