Seminole vs Immigrants from Honduras College, Under 1 year
COMPARE
Seminole
Immigrants from Honduras
College, Under 1 year
College, Under 1 year Comparison
Seminole
Immigrants from Honduras
59.1%
COLLEGE, UNDER 1 YEAR
0.0/ 100
METRIC RATING
293rd/ 347
METRIC RANK
56.5%
COLLEGE, UNDER 1 YEAR
0.0/ 100
METRIC RATING
323rd/ 347
METRIC RANK
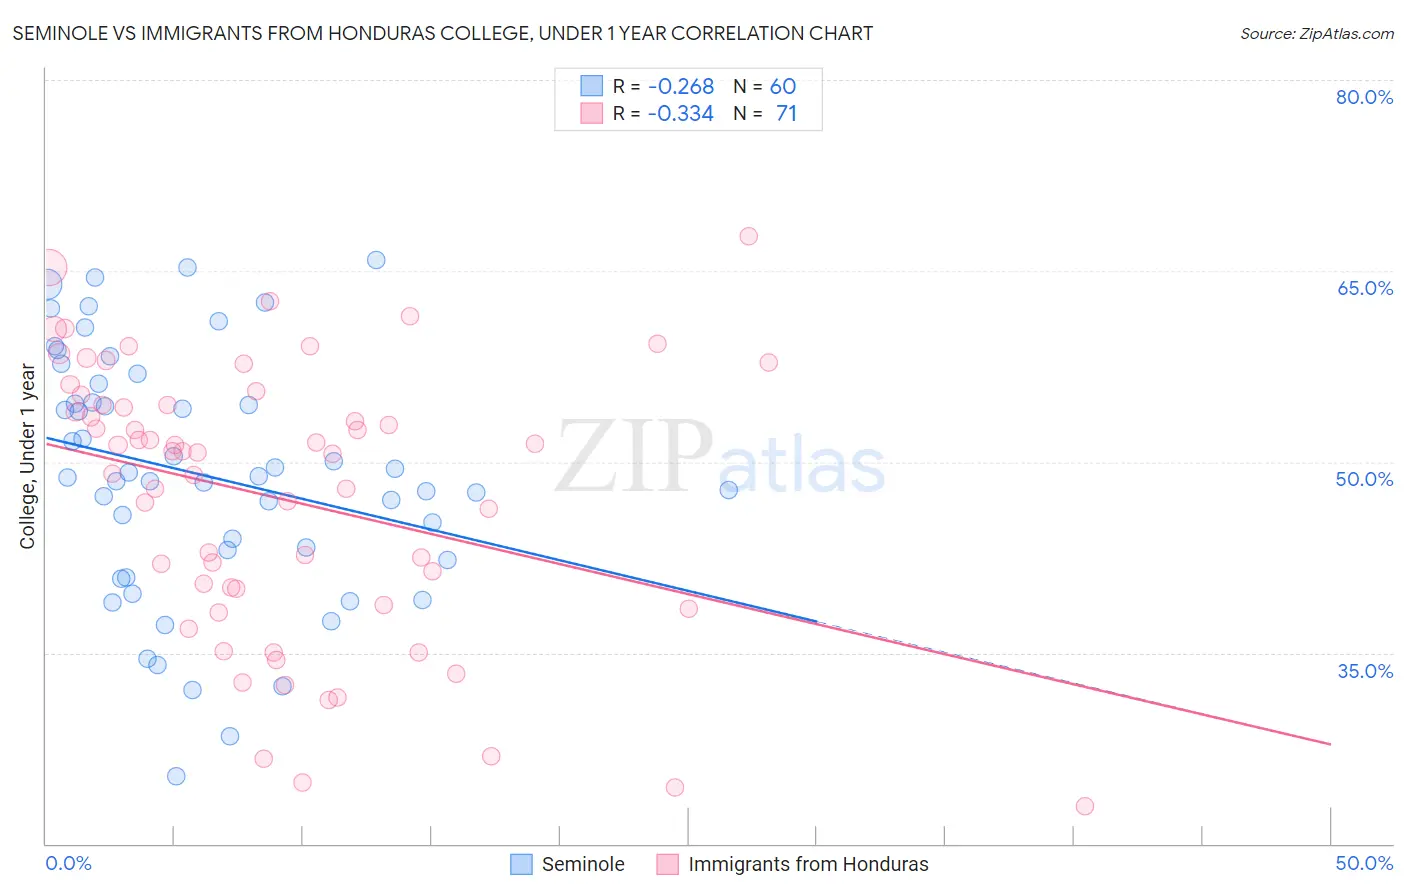
Seminole vs Immigrants from Honduras College, Under 1 year Correlation Chart
The statistical analysis conducted on geographies consisting of 118,314,121 people shows a weak negative correlation between the proportion of Seminole and percentage of population with at least college, under 1 year education in the United States with a correlation coefficient (R) of -0.268 and weighted average of 59.1%. Similarly, the statistical analysis conducted on geographies consisting of 322,637,196 people shows a mild negative correlation between the proportion of Immigrants from Honduras and percentage of population with at least college, under 1 year education in the United States with a correlation coefficient (R) of -0.334 and weighted average of 56.5%, a difference of 4.7%.
College, Under 1 year Correlation Summary
| Measurement | Seminole | Immigrants from Honduras |
| Minimum | 25.3% | 22.9% |
| Maximum | 65.8% | 67.7% |
| Range | 40.5% | 44.7% |
| Mean | 49.0% | 47.1% |
| Median | 48.8% | 50.8% |
| Interquartile 25% (IQ1) | 42.7% | 38.7% |
| Interquartile 75% (IQ3) | 55.4% | 54.5% |
| Interquartile Range (IQR) | 12.7% | 15.8% |
| Standard Deviation (Sample) | 9.6% | 10.8% |
| Standard Deviation (Population) | 9.5% | 10.7% |
Similar Demographics by College, Under 1 year
Demographics Similar to Seminole by College, Under 1 year
In terms of college, under 1 year, the demographic groups most similar to Seminole are Immigrants from Belize (59.1%, a difference of 0.020%), Immigrants from Grenada (59.1%, a difference of 0.12%), Central American Indian (59.0%, a difference of 0.16%), Nicaraguan (59.2%, a difference of 0.18%), and Guyanese (59.0%, a difference of 0.21%).
| Demographics | Rating | Rank | College, Under 1 year |
| British West Indians | 0.0 /100 | #286 | Tragic 59.5% |
| Sioux | 0.0 /100 | #287 | Tragic 59.4% |
| Blacks/African Americans | 0.0 /100 | #288 | Tragic 59.4% |
| Choctaw | 0.0 /100 | #289 | Tragic 59.3% |
| Ecuadorians | 0.0 /100 | #290 | Tragic 59.3% |
| Creek | 0.0 /100 | #291 | Tragic 59.3% |
| Nicaraguans | 0.0 /100 | #292 | Tragic 59.2% |
| Seminole | 0.0 /100 | #293 | Tragic 59.1% |
| Immigrants | Belize | 0.0 /100 | #294 | Tragic 59.1% |
| Immigrants | Grenada | 0.0 /100 | #295 | Tragic 59.1% |
| Central American Indians | 0.0 /100 | #296 | Tragic 59.0% |
| Guyanese | 0.0 /100 | #297 | Tragic 59.0% |
| Immigrants | Ecuador | 0.0 /100 | #298 | Tragic 58.7% |
| Cubans | 0.0 /100 | #299 | Tragic 58.6% |
| Immigrants | Guyana | 0.0 /100 | #300 | Tragic 58.5% |
Demographics Similar to Immigrants from Honduras by College, Under 1 year
In terms of college, under 1 year, the demographic groups most similar to Immigrants from Honduras are Immigrants from El Salvador (56.4%, a difference of 0.13%), Immigrants from Caribbean (56.6%, a difference of 0.18%), Immigrants from Latin America (56.3%, a difference of 0.23%), Native/Alaskan (56.6%, a difference of 0.31%), and Navajo (56.3%, a difference of 0.38%).
| Demographics | Rating | Rank | College, Under 1 year |
| Menominee | 0.0 /100 | #316 | Tragic 57.0% |
| Hispanics or Latinos | 0.0 /100 | #317 | Tragic 57.0% |
| Immigrants | Haiti | 0.0 /100 | #318 | Tragic 56.9% |
| Puerto Ricans | 0.0 /100 | #319 | Tragic 56.8% |
| Guatemalans | 0.0 /100 | #320 | Tragic 56.8% |
| Natives/Alaskans | 0.0 /100 | #321 | Tragic 56.6% |
| Immigrants | Caribbean | 0.0 /100 | #322 | Tragic 56.6% |
| Immigrants | Honduras | 0.0 /100 | #323 | Tragic 56.5% |
| Immigrants | El Salvador | 0.0 /100 | #324 | Tragic 56.4% |
| Immigrants | Latin America | 0.0 /100 | #325 | Tragic 56.3% |
| Navajo | 0.0 /100 | #326 | Tragic 56.3% |
| Immigrants | Guatemala | 0.0 /100 | #327 | Tragic 56.2% |
| Cape Verdeans | 0.0 /100 | #328 | Tragic 56.0% |
| Immigrants | Cuba | 0.0 /100 | #329 | Tragic 55.7% |
| Mexicans | 0.0 /100 | #330 | Tragic 55.6% |