Seminole vs Immigrants from Uzbekistan College, Under 1 year
COMPARE
Seminole
Immigrants from Uzbekistan
College, Under 1 year
College, Under 1 year Comparison
Seminole
Immigrants from Uzbekistan
59.1%
COLLEGE, UNDER 1 YEAR
0.0/ 100
METRIC RATING
293rd/ 347
METRIC RANK
65.8%
COLLEGE, UNDER 1 YEAR
61.6/ 100
METRIC RATING
165th/ 347
METRIC RANK
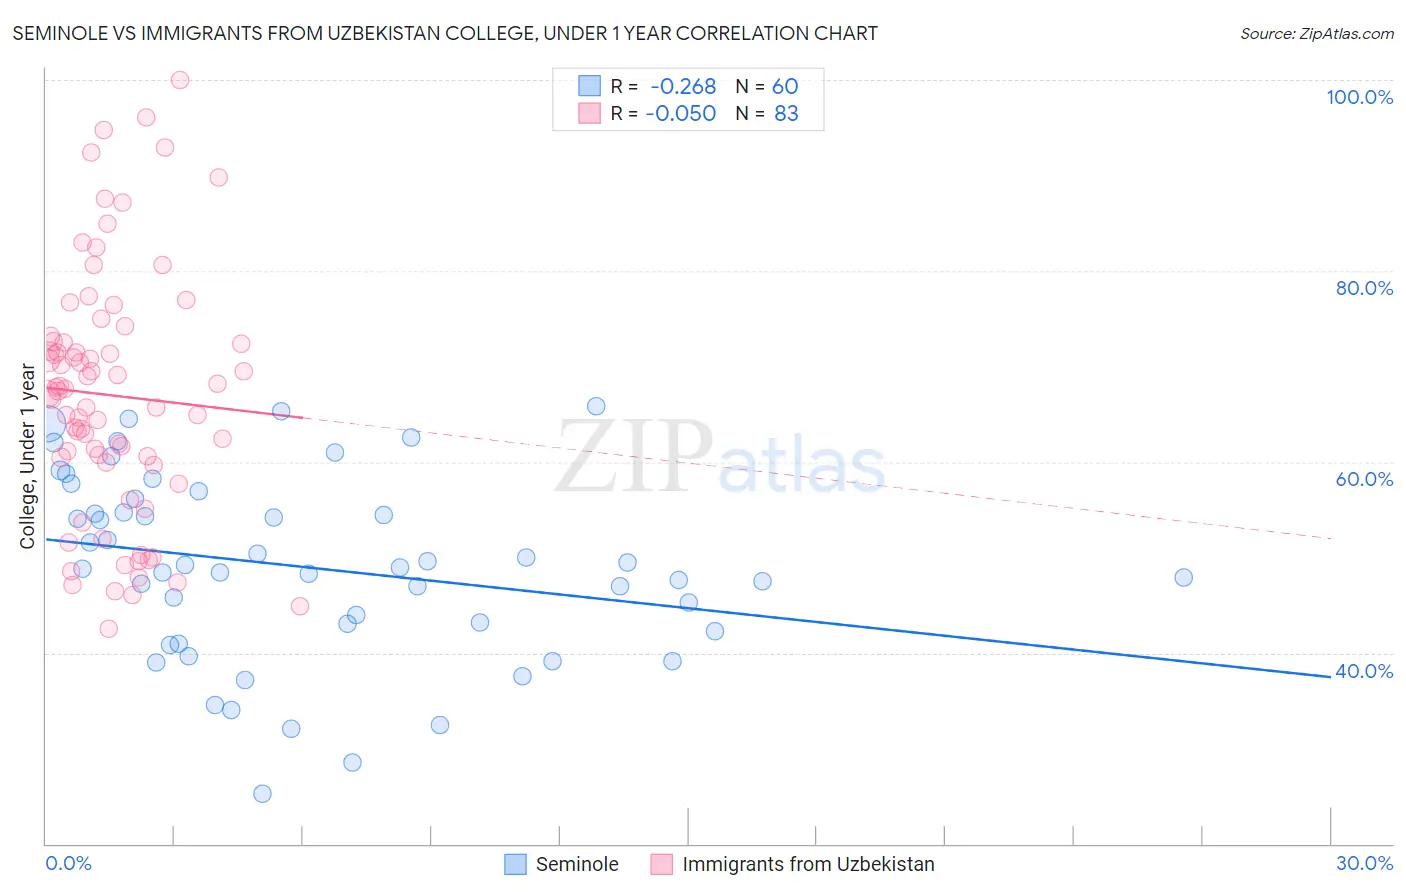
Seminole vs Immigrants from Uzbekistan College, Under 1 year Correlation Chart
The statistical analysis conducted on geographies consisting of 118,314,121 people shows a weak negative correlation between the proportion of Seminole and percentage of population with at least college, under 1 year education in the United States with a correlation coefficient (R) of -0.268 and weighted average of 59.1%. Similarly, the statistical analysis conducted on geographies consisting of 118,765,305 people shows no correlation between the proportion of Immigrants from Uzbekistan and percentage of population with at least college, under 1 year education in the United States with a correlation coefficient (R) of -0.050 and weighted average of 65.8%, a difference of 11.2%.
College, Under 1 year Correlation Summary
| Measurement | Seminole | Immigrants from Uzbekistan |
| Minimum | 25.3% | 42.6% |
| Maximum | 65.8% | 100.0% |
| Range | 40.5% | 57.4% |
| Mean | 49.0% | 67.0% |
| Median | 48.8% | 67.4% |
| Interquartile 25% (IQ1) | 42.7% | 59.9% |
| Interquartile 75% (IQ3) | 55.4% | 72.6% |
| Interquartile Range (IQR) | 12.7% | 12.7% |
| Standard Deviation (Sample) | 9.6% | 12.9% |
| Standard Deviation (Population) | 9.5% | 12.9% |
Similar Demographics by College, Under 1 year
Demographics Similar to Seminole by College, Under 1 year
In terms of college, under 1 year, the demographic groups most similar to Seminole are Immigrants from Belize (59.1%, a difference of 0.020%), Immigrants from Grenada (59.1%, a difference of 0.12%), Central American Indian (59.0%, a difference of 0.16%), Nicaraguan (59.2%, a difference of 0.18%), and Guyanese (59.0%, a difference of 0.21%).
| Demographics | Rating | Rank | College, Under 1 year |
| British West Indians | 0.0 /100 | #286 | Tragic 59.5% |
| Sioux | 0.0 /100 | #287 | Tragic 59.4% |
| Blacks/African Americans | 0.0 /100 | #288 | Tragic 59.4% |
| Choctaw | 0.0 /100 | #289 | Tragic 59.3% |
| Ecuadorians | 0.0 /100 | #290 | Tragic 59.3% |
| Creek | 0.0 /100 | #291 | Tragic 59.3% |
| Nicaraguans | 0.0 /100 | #292 | Tragic 59.2% |
| Seminole | 0.0 /100 | #293 | Tragic 59.1% |
| Immigrants | Belize | 0.0 /100 | #294 | Tragic 59.1% |
| Immigrants | Grenada | 0.0 /100 | #295 | Tragic 59.1% |
| Central American Indians | 0.0 /100 | #296 | Tragic 59.0% |
| Guyanese | 0.0 /100 | #297 | Tragic 59.0% |
| Immigrants | Ecuador | 0.0 /100 | #298 | Tragic 58.7% |
| Cubans | 0.0 /100 | #299 | Tragic 58.6% |
| Immigrants | Guyana | 0.0 /100 | #300 | Tragic 58.5% |
Demographics Similar to Immigrants from Uzbekistan by College, Under 1 year
In terms of college, under 1 year, the demographic groups most similar to Immigrants from Uzbekistan are Somali (65.8%, a difference of 0.050%), Czechoslovakian (65.8%, a difference of 0.050%), Korean (65.9%, a difference of 0.17%), Brazilian (65.9%, a difference of 0.21%), and Albanian (65.9%, a difference of 0.22%).
| Demographics | Rating | Rank | College, Under 1 year |
| Celtics | 67.3 /100 | #158 | Good 65.9% |
| Tlingit-Haida | 66.4 /100 | #159 | Good 65.9% |
| Albanians | 66.1 /100 | #160 | Good 65.9% |
| Brazilians | 66.0 /100 | #161 | Good 65.9% |
| Koreans | 65.3 /100 | #162 | Good 65.9% |
| Somalis | 62.7 /100 | #163 | Good 65.8% |
| Czechoslovakians | 62.6 /100 | #164 | Good 65.8% |
| Immigrants | Uzbekistan | 61.6 /100 | #165 | Good 65.8% |
| Moroccans | 56.7 /100 | #166 | Average 65.6% |
| Immigrants | Somalia | 56.4 /100 | #167 | Average 65.6% |
| Hungarians | 55.9 /100 | #168 | Average 65.6% |
| Yugoslavians | 55.7 /100 | #169 | Average 65.6% |
| Germans | 55.7 /100 | #170 | Average 65.6% |
| Immigrants | Oceania | 55.0 /100 | #171 | Average 65.6% |
| South American Indians | 54.4 /100 | #172 | Average 65.5% |