Irish vs Immigrants from Cabo Verde Professional Degree
COMPARE
Irish
Immigrants from Cabo Verde
Professional Degree
Professional Degree Comparison
Irish
Immigrants from Cabo Verde
4.4%
PROFESSIONAL DEGREE
50.0/ 100
METRIC RATING
175th/ 347
METRIC RANK
3.1%
PROFESSIONAL DEGREE
0.0/ 100
METRIC RATING
330th/ 347
METRIC RANK
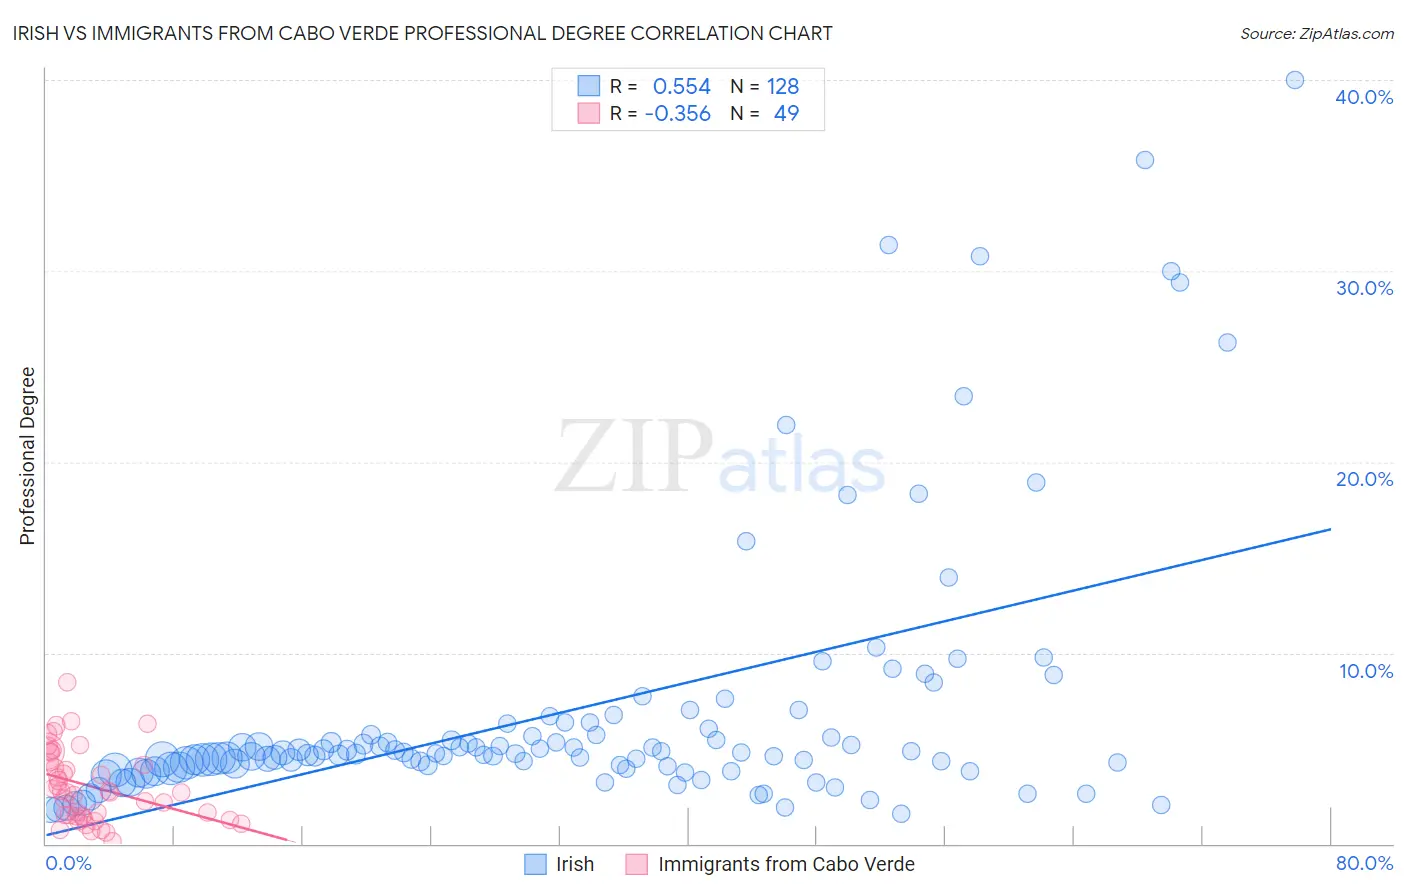
Irish vs Immigrants from Cabo Verde Professional Degree Correlation Chart
The statistical analysis conducted on geographies consisting of 569,237,980 people shows a substantial positive correlation between the proportion of Irish and percentage of population with at least professional degree education in the United States with a correlation coefficient (R) of 0.554 and weighted average of 4.4%. Similarly, the statistical analysis conducted on geographies consisting of 38,118,065 people shows a mild negative correlation between the proportion of Immigrants from Cabo Verde and percentage of population with at least professional degree education in the United States with a correlation coefficient (R) of -0.356 and weighted average of 3.1%, a difference of 42.7%.
Professional Degree Correlation Summary
| Measurement | Irish | Immigrants from Cabo Verde |
| Minimum | 1.5% | 0.14% |
| Maximum | 40.0% | 8.5% |
| Range | 38.5% | 8.3% |
| Mean | 7.0% | 3.0% |
| Median | 4.7% | 2.7% |
| Interquartile 25% (IQ1) | 4.0% | 1.4% |
| Interquartile 75% (IQ3) | 5.9% | 4.5% |
| Interquartile Range (IQR) | 1.9% | 3.1% |
| Standard Deviation (Sample) | 7.1% | 1.9% |
| Standard Deviation (Population) | 7.1% | 1.9% |
Similar Demographics by Professional Degree
Demographics Similar to Irish by Professional Degree
In terms of professional degree, the demographic groups most similar to Irish are Kenyan (4.4%, a difference of 0.0%), English (4.4%, a difference of 0.020%), Immigrants from Peru (4.4%, a difference of 0.10%), Spaniard (4.4%, a difference of 0.30%), and Celtic (4.4%, a difference of 0.35%).
| Demographics | Rating | Rank | Professional Degree |
| Immigrants | Sierra Leone | 58.7 /100 | #168 | Average 4.5% |
| Chinese | 58.6 /100 | #169 | Average 4.5% |
| Immigrants | Zaire | 57.4 /100 | #170 | Average 4.5% |
| Immigrants | Bangladesh | 56.0 /100 | #171 | Average 4.4% |
| Spaniards | 52.0 /100 | #172 | Average 4.4% |
| English | 50.1 /100 | #173 | Average 4.4% |
| Kenyans | 50.0 /100 | #174 | Average 4.4% |
| Irish | 50.0 /100 | #175 | Average 4.4% |
| Immigrants | Peru | 49.3 /100 | #176 | Average 4.4% |
| Celtics | 47.6 /100 | #177 | Average 4.4% |
| Immigrants | Costa Rica | 46.7 /100 | #178 | Average 4.4% |
| Immigrants | Kenya | 45.9 /100 | #179 | Average 4.4% |
| Czechs | 44.9 /100 | #180 | Average 4.4% |
| Danes | 43.5 /100 | #181 | Average 4.4% |
| Immigrants | Immigrants | 43.2 /100 | #182 | Average 4.4% |
Demographics Similar to Immigrants from Cabo Verde by Professional Degree
In terms of professional degree, the demographic groups most similar to Immigrants from Cabo Verde are Bangladeshi (3.1%, a difference of 0.080%), Kiowa (3.1%, a difference of 0.12%), Yakama (3.1%, a difference of 0.23%), Puget Sound Salish (3.1%, a difference of 0.26%), and Creek (3.1%, a difference of 0.29%).
| Demographics | Rating | Rank | Professional Degree |
| Inupiat | 0.0 /100 | #323 | Tragic 3.2% |
| Crow | 0.0 /100 | #324 | Tragic 3.2% |
| Yaqui | 0.0 /100 | #325 | Tragic 3.2% |
| Menominee | 0.0 /100 | #326 | Tragic 3.1% |
| Dutch West Indians | 0.0 /100 | #327 | Tragic 3.1% |
| Creek | 0.0 /100 | #328 | Tragic 3.1% |
| Bangladeshis | 0.0 /100 | #329 | Tragic 3.1% |
| Immigrants | Cabo Verde | 0.0 /100 | #330 | Tragic 3.1% |
| Kiowa | 0.0 /100 | #331 | Tragic 3.1% |
| Yakama | 0.0 /100 | #332 | Tragic 3.1% |
| Puget Sound Salish | 0.0 /100 | #333 | Tragic 3.1% |
| Pennsylvania Germans | 0.0 /100 | #334 | Tragic 3.0% |
| Natives/Alaskans | 0.0 /100 | #335 | Tragic 3.0% |
| Fijians | 0.0 /100 | #336 | Tragic 2.9% |
| Arapaho | 0.0 /100 | #337 | Tragic 2.9% |