Mexican American Indian vs Immigrants from Cabo Verde Professional Degree
COMPARE
Mexican American Indian
Immigrants from Cabo Verde
Professional Degree
Professional Degree Comparison
Mexican American Indians
Immigrants from Cabo Verde
3.3%
PROFESSIONAL DEGREE
0.1/ 100
METRIC RATING
314th/ 347
METRIC RANK
3.1%
PROFESSIONAL DEGREE
0.0/ 100
METRIC RATING
330th/ 347
METRIC RANK
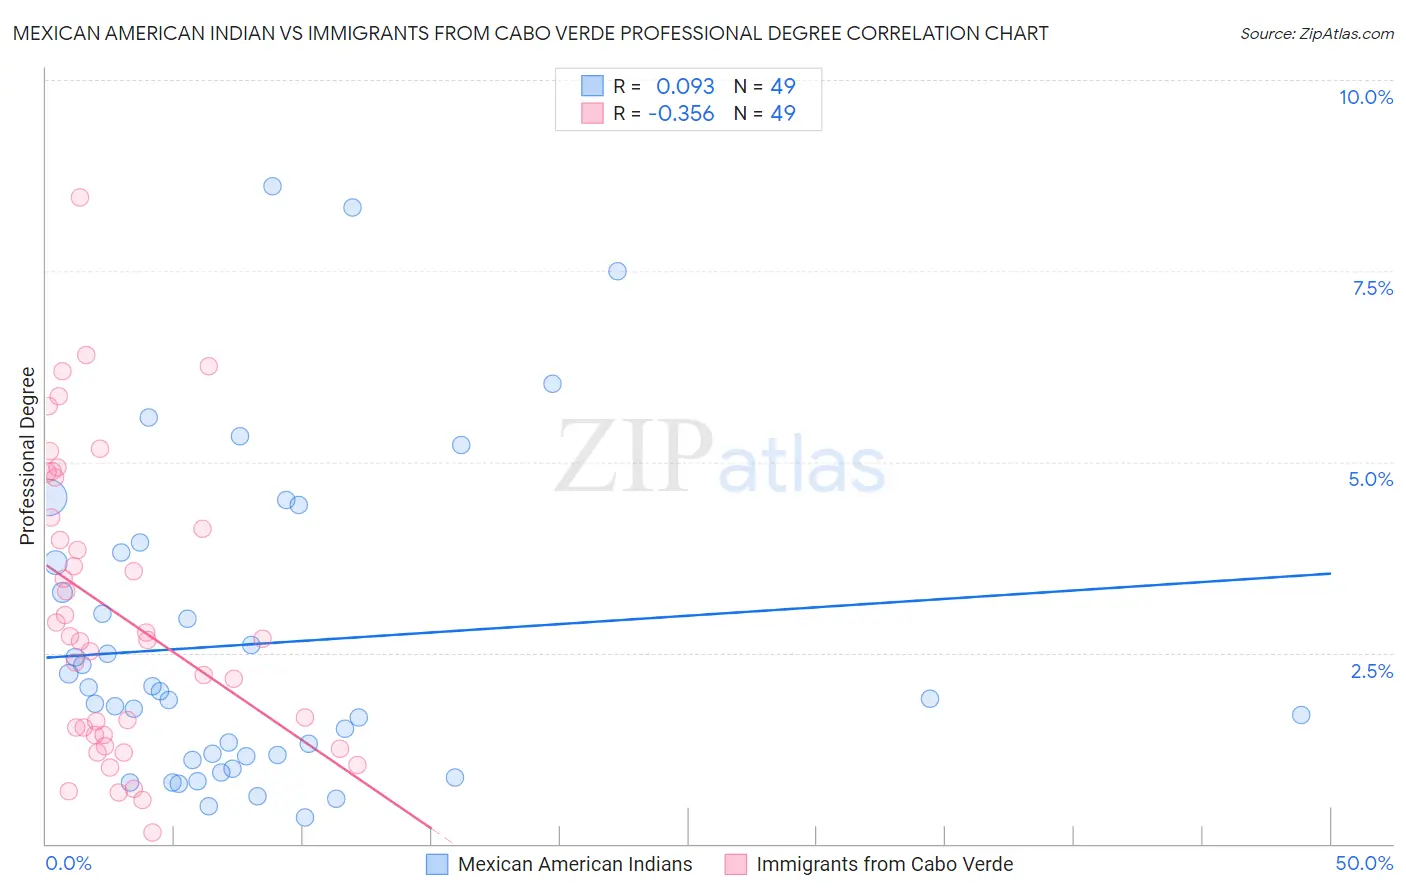
Mexican American Indian vs Immigrants from Cabo Verde Professional Degree Correlation Chart
The statistical analysis conducted on geographies consisting of 316,680,392 people shows a slight positive correlation between the proportion of Mexican American Indians and percentage of population with at least professional degree education in the United States with a correlation coefficient (R) of 0.093 and weighted average of 3.3%. Similarly, the statistical analysis conducted on geographies consisting of 38,118,065 people shows a mild negative correlation between the proportion of Immigrants from Cabo Verde and percentage of population with at least professional degree education in the United States with a correlation coefficient (R) of -0.356 and weighted average of 3.1%, a difference of 5.8%.
Professional Degree Correlation Summary
| Measurement | Mexican American Indian | Immigrants from Cabo Verde |
| Minimum | 0.34% | 0.14% |
| Maximum | 8.6% | 8.5% |
| Range | 8.3% | 8.3% |
| Mean | 2.6% | 3.0% |
| Median | 1.9% | 2.7% |
| Interquartile 25% (IQ1) | 1.1% | 1.4% |
| Interquartile 75% (IQ3) | 3.7% | 4.5% |
| Interquartile Range (IQR) | 2.6% | 3.1% |
| Standard Deviation (Sample) | 2.0% | 1.9% |
| Standard Deviation (Population) | 2.0% | 1.9% |
Demographics Similar to Mexican American Indians and Immigrants from Cabo Verde by Professional Degree
In terms of professional degree, the demographic groups most similar to Mexican American Indians are Yuman (3.3%, a difference of 0.21%), Sioux (3.3%, a difference of 0.23%), Immigrants from Laos (3.2%, a difference of 0.68%), Puerto Rican (3.2%, a difference of 0.69%), and Nepalese (3.2%, a difference of 0.90%). Similarly, the demographic groups most similar to Immigrants from Cabo Verde are Bangladeshi (3.1%, a difference of 0.080%), Kiowa (3.1%, a difference of 0.12%), Yakama (3.1%, a difference of 0.23%), Creek (3.1%, a difference of 0.29%), and Dutch West Indian (3.1%, a difference of 0.35%).
| Demographics | Rating | Rank | Professional Degree |
| Sioux | 0.1 /100 | #312 | Tragic 3.3% |
| Yuman | 0.1 /100 | #313 | Tragic 3.3% |
| Mexican American Indians | 0.1 /100 | #314 | Tragic 3.3% |
| Immigrants | Laos | 0.1 /100 | #315 | Tragic 3.2% |
| Puerto Ricans | 0.1 /100 | #316 | Tragic 3.2% |
| Nepalese | 0.1 /100 | #317 | Tragic 3.2% |
| Immigrants | Micronesia | 0.1 /100 | #318 | Tragic 3.2% |
| Choctaw | 0.1 /100 | #319 | Tragic 3.2% |
| Seminole | 0.1 /100 | #320 | Tragic 3.2% |
| Tsimshian | 0.0 /100 | #321 | Tragic 3.2% |
| Hispanics or Latinos | 0.0 /100 | #322 | Tragic 3.2% |
| Inupiat | 0.0 /100 | #323 | Tragic 3.2% |
| Crow | 0.0 /100 | #324 | Tragic 3.2% |
| Yaqui | 0.0 /100 | #325 | Tragic 3.2% |
| Menominee | 0.0 /100 | #326 | Tragic 3.1% |
| Dutch West Indians | 0.0 /100 | #327 | Tragic 3.1% |
| Creek | 0.0 /100 | #328 | Tragic 3.1% |
| Bangladeshis | 0.0 /100 | #329 | Tragic 3.1% |
| Immigrants | Cabo Verde | 0.0 /100 | #330 | Tragic 3.1% |
| Kiowa | 0.0 /100 | #331 | Tragic 3.1% |
| Yakama | 0.0 /100 | #332 | Tragic 3.1% |