Nicaraguan vs French Professional Degree
COMPARE
Nicaraguan
French
Professional Degree
Professional Degree Comparison
Nicaraguans
French
3.9%
PROFESSIONAL DEGREE
5.1/ 100
METRIC RATING
230th/ 347
METRIC RANK
4.2%
PROFESSIONAL DEGREE
27.1/ 100
METRIC RATING
193rd/ 347
METRIC RANK
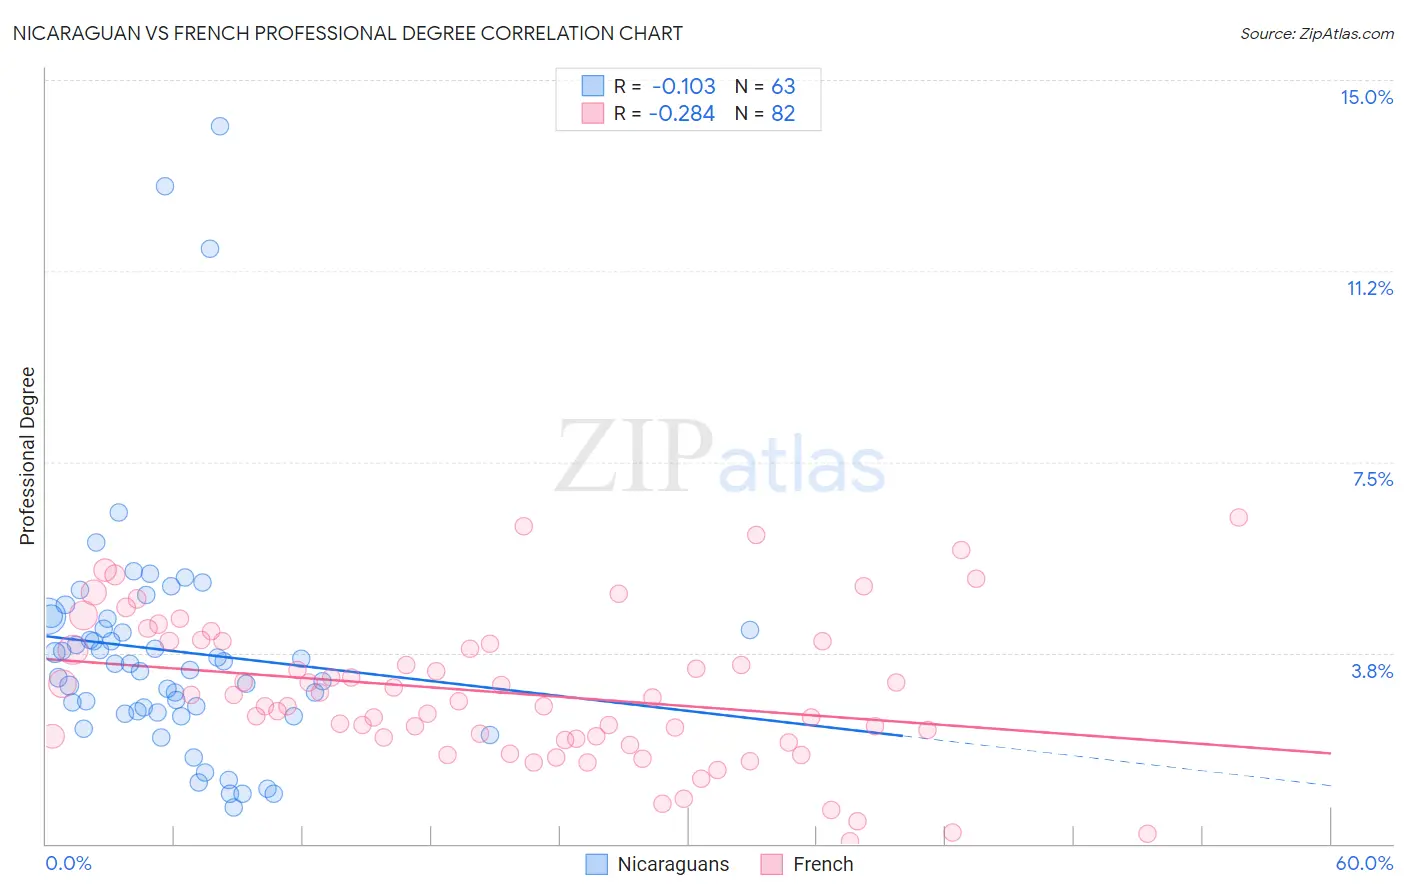
Nicaraguan vs French Professional Degree Correlation Chart
The statistical analysis conducted on geographies consisting of 285,287,812 people shows a poor negative correlation between the proportion of Nicaraguans and percentage of population with at least professional degree education in the United States with a correlation coefficient (R) of -0.103 and weighted average of 3.9%. Similarly, the statistical analysis conducted on geographies consisting of 564,087,067 people shows a weak negative correlation between the proportion of French and percentage of population with at least professional degree education in the United States with a correlation coefficient (R) of -0.284 and weighted average of 4.2%, a difference of 7.9%.
Professional Degree Correlation Summary
| Measurement | Nicaraguan | French |
| Minimum | 0.72% | 0.047% |
| Maximum | 14.1% | 6.4% |
| Range | 13.4% | 6.4% |
| Mean | 3.8% | 3.0% |
| Median | 3.5% | 2.8% |
| Interquartile 25% (IQ1) | 2.6% | 2.1% |
| Interquartile 75% (IQ3) | 4.4% | 4.0% |
| Interquartile Range (IQR) | 1.8% | 1.9% |
| Standard Deviation (Sample) | 2.4% | 1.4% |
| Standard Deviation (Population) | 2.4% | 1.4% |
Similar Demographics by Professional Degree
Demographics Similar to Nicaraguans by Professional Degree
In terms of professional degree, the demographic groups most similar to Nicaraguans are Immigrants from Burma/Myanmar (3.9%, a difference of 0.27%), Immigrants from West Indies (4.0%, a difference of 0.42%), Ecuadorian (3.9%, a difference of 0.46%), Cuban (4.0%, a difference of 0.67%), and Cree (3.9%, a difference of 0.67%).
| Demographics | Rating | Rank | Professional Degree |
| Immigrants | Bosnia and Herzegovina | 7.4 /100 | #223 | Tragic 4.0% |
| Trinidadians and Tobagonians | 7.1 /100 | #224 | Tragic 4.0% |
| Tlingit-Haida | 6.9 /100 | #225 | Tragic 4.0% |
| German Russians | 6.1 /100 | #226 | Tragic 4.0% |
| Cubans | 5.9 /100 | #227 | Tragic 4.0% |
| Immigrants | West Indies | 5.6 /100 | #228 | Tragic 4.0% |
| Immigrants | Burma/Myanmar | 5.4 /100 | #229 | Tragic 3.9% |
| Nicaraguans | 5.1 /100 | #230 | Tragic 3.9% |
| Ecuadorians | 4.6 /100 | #231 | Tragic 3.9% |
| Cree | 4.3 /100 | #232 | Tragic 3.9% |
| Immigrants | Philippines | 4.1 /100 | #233 | Tragic 3.9% |
| Immigrants | Nonimmigrants | 4.0 /100 | #234 | Tragic 3.9% |
| Immigrants | Barbados | 4.0 /100 | #235 | Tragic 3.9% |
| Spanish Americans | 3.8 /100 | #236 | Tragic 3.9% |
| Immigrants | Trinidad and Tobago | 3.8 /100 | #237 | Tragic 3.9% |
Demographics Similar to French by Professional Degree
In terms of professional degree, the demographic groups most similar to French are Ghanaian (4.3%, a difference of 0.040%), Scandinavian (4.2%, a difference of 0.25%), Sri Lankan (4.3%, a difference of 0.37%), Immigrants from Poland (4.3%, a difference of 0.40%), and Nigerian (4.2%, a difference of 0.49%).
| Demographics | Rating | Rank | Professional Degree |
| Scotch-Irish | 34.2 /100 | #186 | Fair 4.3% |
| Immigrants | Cameroon | 33.3 /100 | #187 | Fair 4.3% |
| Immigrants | Thailand | 31.7 /100 | #188 | Fair 4.3% |
| Slovaks | 30.7 /100 | #189 | Fair 4.3% |
| Immigrants | Poland | 29.2 /100 | #190 | Fair 4.3% |
| Sri Lankans | 29.0 /100 | #191 | Fair 4.3% |
| Ghanaians | 27.3 /100 | #192 | Fair 4.3% |
| French | 27.1 /100 | #193 | Fair 4.2% |
| Scandinavians | 25.8 /100 | #194 | Fair 4.2% |
| Nigerians | 24.6 /100 | #195 | Fair 4.2% |
| Spanish | 23.0 /100 | #196 | Fair 4.2% |
| Czechoslovakians | 22.4 /100 | #197 | Fair 4.2% |
| Immigrants | Middle Africa | 22.1 /100 | #198 | Fair 4.2% |
| Norwegians | 20.5 /100 | #199 | Fair 4.2% |
| Immigrants | North Macedonia | 20.2 /100 | #200 | Fair 4.2% |