Immigrants from Haiti vs French Professional Degree
COMPARE
Immigrants from Haiti
French
Professional Degree
Professional Degree Comparison
Immigrants from Haiti
French
3.4%
PROFESSIONAL DEGREE
0.2/ 100
METRIC RATING
303rd/ 347
METRIC RANK
4.2%
PROFESSIONAL DEGREE
27.1/ 100
METRIC RATING
193rd/ 347
METRIC RANK
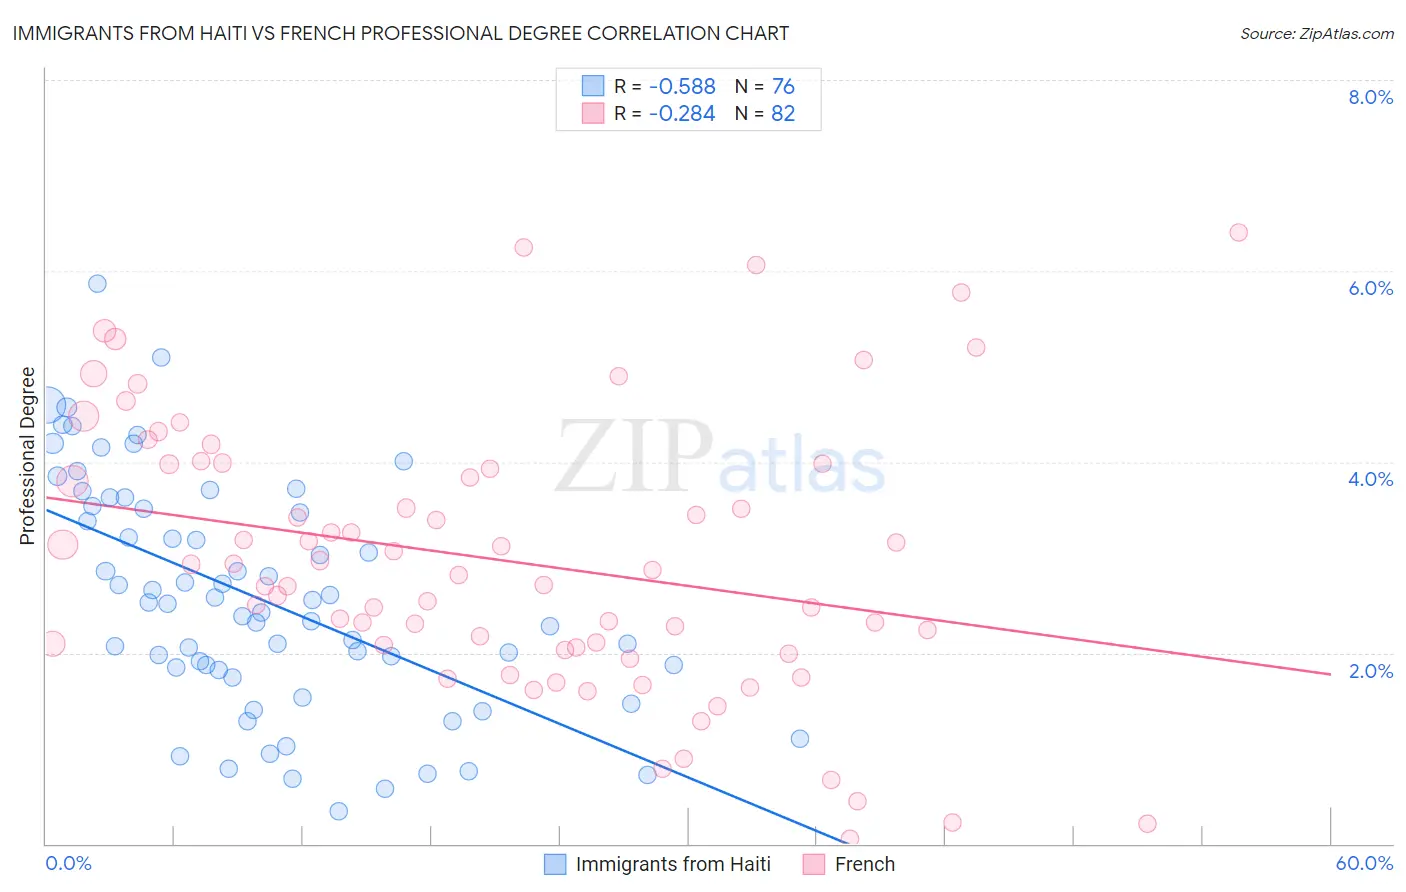
Immigrants from Haiti vs French Professional Degree Correlation Chart
The statistical analysis conducted on geographies consisting of 224,987,454 people shows a substantial negative correlation between the proportion of Immigrants from Haiti and percentage of population with at least professional degree education in the United States with a correlation coefficient (R) of -0.588 and weighted average of 3.4%. Similarly, the statistical analysis conducted on geographies consisting of 564,087,067 people shows a weak negative correlation between the proportion of French and percentage of population with at least professional degree education in the United States with a correlation coefficient (R) of -0.284 and weighted average of 4.2%, a difference of 26.0%.
Professional Degree Correlation Summary
| Measurement | Immigrants from Haiti | French |
| Minimum | 0.34% | 0.047% |
| Maximum | 5.9% | 6.4% |
| Range | 5.5% | 6.4% |
| Mean | 2.6% | 3.0% |
| Median | 2.5% | 2.8% |
| Interquartile 25% (IQ1) | 1.8% | 2.1% |
| Interquartile 75% (IQ3) | 3.5% | 4.0% |
| Interquartile Range (IQR) | 1.7% | 1.9% |
| Standard Deviation (Sample) | 1.2% | 1.4% |
| Standard Deviation (Population) | 1.2% | 1.4% |
Similar Demographics by Professional Degree
Demographics Similar to Immigrants from Haiti by Professional Degree
In terms of professional degree, the demographic groups most similar to Immigrants from Haiti are Cajun (3.4%, a difference of 0.010%), Chickasaw (3.4%, a difference of 0.31%), Cape Verdean (3.4%, a difference of 0.32%), Malaysian (3.4%, a difference of 0.66%), and Immigrants from Dominican Republic (3.4%, a difference of 0.76%).
| Demographics | Rating | Rank | Professional Degree |
| Hawaiians | 0.2 /100 | #296 | Tragic 3.4% |
| Immigrants | Liberia | 0.2 /100 | #297 | Tragic 3.4% |
| Ottawa | 0.2 /100 | #298 | Tragic 3.4% |
| Immigrants | Yemen | 0.2 /100 | #299 | Tragic 3.4% |
| Blacks/African Americans | 0.2 /100 | #300 | Tragic 3.4% |
| Immigrants | Dominican Republic | 0.2 /100 | #301 | Tragic 3.4% |
| Malaysians | 0.2 /100 | #302 | Tragic 3.4% |
| Immigrants | Haiti | 0.2 /100 | #303 | Tragic 3.4% |
| Cajuns | 0.2 /100 | #304 | Tragic 3.4% |
| Chickasaw | 0.1 /100 | #305 | Tragic 3.4% |
| Cape Verdeans | 0.1 /100 | #306 | Tragic 3.4% |
| Samoans | 0.1 /100 | #307 | Tragic 3.3% |
| Shoshone | 0.1 /100 | #308 | Tragic 3.3% |
| Pima | 0.1 /100 | #309 | Tragic 3.3% |
| Immigrants | Latin America | 0.1 /100 | #310 | Tragic 3.3% |
Demographics Similar to French by Professional Degree
In terms of professional degree, the demographic groups most similar to French are Ghanaian (4.3%, a difference of 0.040%), Scandinavian (4.2%, a difference of 0.25%), Sri Lankan (4.3%, a difference of 0.37%), Immigrants from Poland (4.3%, a difference of 0.40%), and Nigerian (4.2%, a difference of 0.49%).
| Demographics | Rating | Rank | Professional Degree |
| Scotch-Irish | 34.2 /100 | #186 | Fair 4.3% |
| Immigrants | Cameroon | 33.3 /100 | #187 | Fair 4.3% |
| Immigrants | Thailand | 31.7 /100 | #188 | Fair 4.3% |
| Slovaks | 30.7 /100 | #189 | Fair 4.3% |
| Immigrants | Poland | 29.2 /100 | #190 | Fair 4.3% |
| Sri Lankans | 29.0 /100 | #191 | Fair 4.3% |
| Ghanaians | 27.3 /100 | #192 | Fair 4.3% |
| French | 27.1 /100 | #193 | Fair 4.2% |
| Scandinavians | 25.8 /100 | #194 | Fair 4.2% |
| Nigerians | 24.6 /100 | #195 | Fair 4.2% |
| Spanish | 23.0 /100 | #196 | Fair 4.2% |
| Czechoslovakians | 22.4 /100 | #197 | Fair 4.2% |
| Immigrants | Middle Africa | 22.1 /100 | #198 | Fair 4.2% |
| Norwegians | 20.5 /100 | #199 | Fair 4.2% |
| Immigrants | North Macedonia | 20.2 /100 | #200 | Fair 4.2% |