Immigrants from Ecuador vs French Professional Degree
COMPARE
Immigrants from Ecuador
French
Professional Degree
Professional Degree Comparison
Immigrants from Ecuador
French
3.8%
PROFESSIONAL DEGREE
2.3/ 100
METRIC RATING
240th/ 347
METRIC RANK
4.2%
PROFESSIONAL DEGREE
27.1/ 100
METRIC RATING
193rd/ 347
METRIC RANK
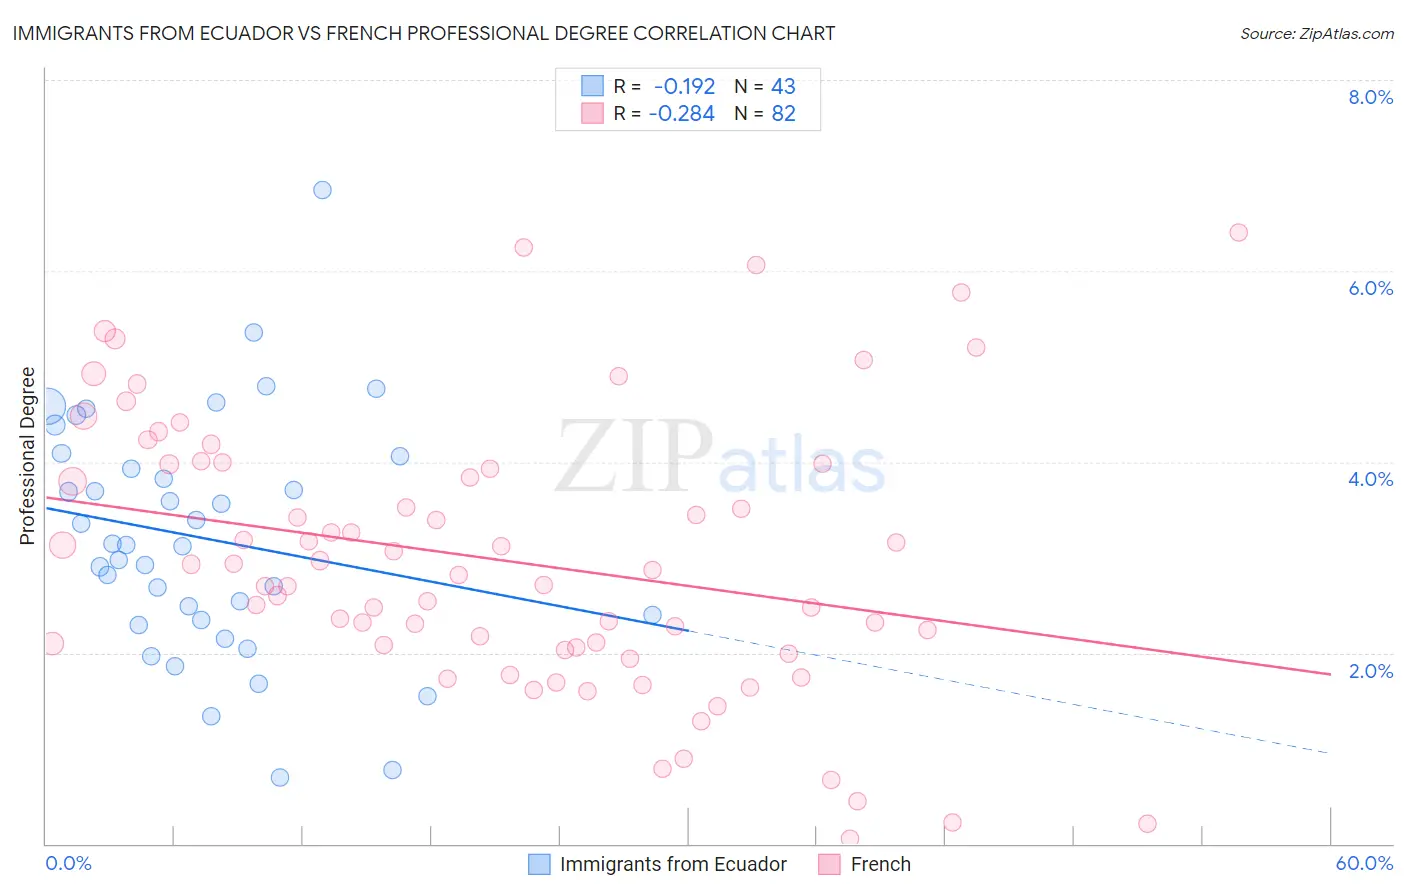
Immigrants from Ecuador vs French Professional Degree Correlation Chart
The statistical analysis conducted on geographies consisting of 270,711,574 people shows a poor negative correlation between the proportion of Immigrants from Ecuador and percentage of population with at least professional degree education in the United States with a correlation coefficient (R) of -0.192 and weighted average of 3.8%. Similarly, the statistical analysis conducted on geographies consisting of 564,087,067 people shows a weak negative correlation between the proportion of French and percentage of population with at least professional degree education in the United States with a correlation coefficient (R) of -0.284 and weighted average of 4.2%, a difference of 11.6%.
Professional Degree Correlation Summary
| Measurement | Immigrants from Ecuador | French |
| Minimum | 0.70% | 0.047% |
| Maximum | 6.9% | 6.4% |
| Range | 6.2% | 6.4% |
| Mean | 3.2% | 3.0% |
| Median | 3.1% | 2.8% |
| Interquartile 25% (IQ1) | 2.3% | 2.1% |
| Interquartile 75% (IQ3) | 4.1% | 4.0% |
| Interquartile Range (IQR) | 1.7% | 1.9% |
| Standard Deviation (Sample) | 1.3% | 1.4% |
| Standard Deviation (Population) | 1.2% | 1.4% |
Similar Demographics by Professional Degree
Demographics Similar to Immigrants from Ecuador by Professional Degree
In terms of professional degree, the demographic groups most similar to Immigrants from Ecuador are Alaskan Athabascan (3.8%, a difference of 0.020%), Native Hawaiian (3.8%, a difference of 0.020%), Guamanian/Chamorro (3.8%, a difference of 0.10%), British West Indian (3.8%, a difference of 0.23%), and Immigrants from Bahamas (3.8%, a difference of 0.53%).
| Demographics | Rating | Rank | Professional Degree |
| Immigrants | Philippines | 4.1 /100 | #233 | Tragic 3.9% |
| Immigrants | Nonimmigrants | 4.0 /100 | #234 | Tragic 3.9% |
| Immigrants | Barbados | 4.0 /100 | #235 | Tragic 3.9% |
| Spanish Americans | 3.8 /100 | #236 | Tragic 3.9% |
| Immigrants | Trinidad and Tobago | 3.8 /100 | #237 | Tragic 3.9% |
| Colville | 2.6 /100 | #238 | Tragic 3.8% |
| British West Indians | 2.4 /100 | #239 | Tragic 3.8% |
| Immigrants | Ecuador | 2.3 /100 | #240 | Tragic 3.8% |
| Alaskan Athabascans | 2.3 /100 | #241 | Tragic 3.8% |
| Native Hawaiians | 2.3 /100 | #242 | Tragic 3.8% |
| Guamanians/Chamorros | 2.2 /100 | #243 | Tragic 3.8% |
| Immigrants | Bahamas | 2.0 /100 | #244 | Tragic 3.8% |
| French American Indians | 1.7 /100 | #245 | Tragic 3.8% |
| Marshallese | 1.7 /100 | #246 | Tragic 3.8% |
| Guyanese | 1.6 /100 | #247 | Tragic 3.8% |
Demographics Similar to French by Professional Degree
In terms of professional degree, the demographic groups most similar to French are Ghanaian (4.3%, a difference of 0.040%), Scandinavian (4.2%, a difference of 0.25%), Sri Lankan (4.3%, a difference of 0.37%), Immigrants from Poland (4.3%, a difference of 0.40%), and Nigerian (4.2%, a difference of 0.49%).
| Demographics | Rating | Rank | Professional Degree |
| Scotch-Irish | 34.2 /100 | #186 | Fair 4.3% |
| Immigrants | Cameroon | 33.3 /100 | #187 | Fair 4.3% |
| Immigrants | Thailand | 31.7 /100 | #188 | Fair 4.3% |
| Slovaks | 30.7 /100 | #189 | Fair 4.3% |
| Immigrants | Poland | 29.2 /100 | #190 | Fair 4.3% |
| Sri Lankans | 29.0 /100 | #191 | Fair 4.3% |
| Ghanaians | 27.3 /100 | #192 | Fair 4.3% |
| French | 27.1 /100 | #193 | Fair 4.2% |
| Scandinavians | 25.8 /100 | #194 | Fair 4.2% |
| Nigerians | 24.6 /100 | #195 | Fair 4.2% |
| Spanish | 23.0 /100 | #196 | Fair 4.2% |
| Czechoslovakians | 22.4 /100 | #197 | Fair 4.2% |
| Immigrants | Middle Africa | 22.1 /100 | #198 | Fair 4.2% |
| Norwegians | 20.5 /100 | #199 | Fair 4.2% |
| Immigrants | North Macedonia | 20.2 /100 | #200 | Fair 4.2% |