Scottish vs Bulgarian 9th Grade
COMPARE
Scottish
Bulgarian
9th Grade
9th Grade Comparison
Scottish
Bulgarians
96.5%
9TH GRADE
100.0/ 100
METRIC RATING
14th/ 347
METRIC RANK
96.2%
9TH GRADE
99.9/ 100
METRIC RATING
35th/ 347
METRIC RANK
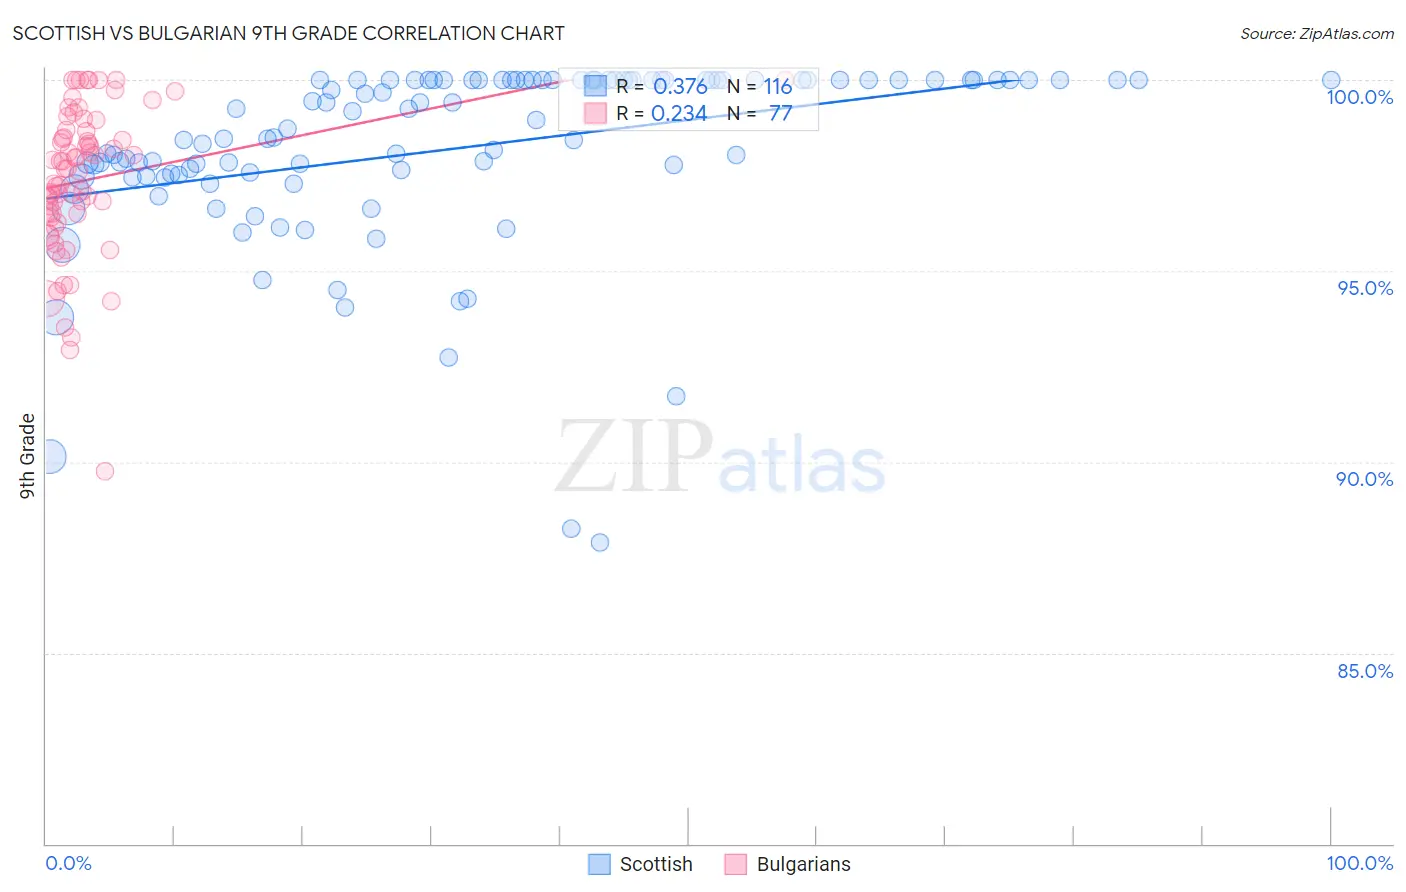
Scottish vs Bulgarian 9th Grade Correlation Chart
The statistical analysis conducted on geographies consisting of 567,141,209 people shows a mild positive correlation between the proportion of Scottish and percentage of population with at least 9th grade education in the United States with a correlation coefficient (R) of 0.376 and weighted average of 96.5%. Similarly, the statistical analysis conducted on geographies consisting of 205,632,748 people shows a weak positive correlation between the proportion of Bulgarians and percentage of population with at least 9th grade education in the United States with a correlation coefficient (R) of 0.234 and weighted average of 96.2%, a difference of 0.35%.
9th Grade Correlation Summary
| Measurement | Scottish | Bulgarian |
| Minimum | 87.9% | 89.7% |
| Maximum | 100.0% | 100.0% |
| Range | 12.1% | 10.3% |
| Mean | 98.2% | 97.4% |
| Median | 98.8% | 97.7% |
| Interquartile 25% (IQ1) | 97.5% | 96.5% |
| Interquartile 75% (IQ3) | 100.0% | 98.7% |
| Interquartile Range (IQR) | 2.5% | 2.2% |
| Standard Deviation (Sample) | 2.4% | 2.0% |
| Standard Deviation (Population) | 2.4% | 1.9% |
Similar Demographics by 9th Grade
Demographics Similar to Scottish by 9th Grade
In terms of 9th grade, the demographic groups most similar to Scottish are Irish (96.5%, a difference of 0.0%), Croatian (96.5%, a difference of 0.0%), Danish (96.5%, a difference of 0.010%), English (96.6%, a difference of 0.050%), and Lithuanian (96.6%, a difference of 0.070%).
| Demographics | Rating | Rank | 9th Grade |
| Carpatho Rusyns | 100.0 /100 | #7 | Exceptional 96.7% |
| Germans | 100.0 /100 | #8 | Exceptional 96.7% |
| Tlingit-Haida | 100.0 /100 | #9 | Exceptional 96.6% |
| Lithuanians | 100.0 /100 | #10 | Exceptional 96.6% |
| Finns | 100.0 /100 | #11 | Exceptional 96.6% |
| English | 100.0 /100 | #12 | Exceptional 96.6% |
| Danes | 100.0 /100 | #13 | Exceptional 96.5% |
| Scottish | 100.0 /100 | #14 | Exceptional 96.5% |
| Irish | 100.0 /100 | #15 | Exceptional 96.5% |
| Croatians | 100.0 /100 | #16 | Exceptional 96.5% |
| Dutch | 100.0 /100 | #17 | Exceptional 96.5% |
| Scandinavians | 100.0 /100 | #18 | Exceptional 96.5% |
| Welsh | 100.0 /100 | #19 | Exceptional 96.4% |
| Italians | 100.0 /100 | #20 | Exceptional 96.4% |
| Alaskan Athabascans | 100.0 /100 | #21 | Exceptional 96.4% |
Demographics Similar to Bulgarians by 9th Grade
In terms of 9th grade, the demographic groups most similar to Bulgarians are Northern European (96.2%, a difference of 0.010%), Hungarian (96.2%, a difference of 0.040%), Estonian (96.1%, a difference of 0.050%), Immigrants from Scotland (96.1%, a difference of 0.050%), and Luxembourger (96.3%, a difference of 0.070%).
| Demographics | Rating | Rank | 9th Grade |
| Eastern Europeans | 100.0 /100 | #28 | Exceptional 96.3% |
| Chinese | 100.0 /100 | #29 | Exceptional 96.3% |
| Maltese | 100.0 /100 | #30 | Exceptional 96.3% |
| British | 100.0 /100 | #31 | Exceptional 96.3% |
| Belgians | 100.0 /100 | #32 | Exceptional 96.3% |
| Luxembourgers | 100.0 /100 | #33 | Exceptional 96.3% |
| Hungarians | 100.0 /100 | #34 | Exceptional 96.2% |
| Bulgarians | 99.9 /100 | #35 | Exceptional 96.2% |
| Northern Europeans | 99.9 /100 | #36 | Exceptional 96.2% |
| Estonians | 99.9 /100 | #37 | Exceptional 96.1% |
| Immigrants | Scotland | 99.9 /100 | #38 | Exceptional 96.1% |
| Ottawa | 99.9 /100 | #39 | Exceptional 96.1% |
| Slavs | 99.9 /100 | #40 | Exceptional 96.1% |
| Czechoslovakians | 99.9 /100 | #41 | Exceptional 96.1% |
| Chippewa | 99.9 /100 | #42 | Exceptional 96.1% |