Costa Rican vs Tsimshian Bachelor's Degree
COMPARE
Costa Rican
Tsimshian
Bachelor's Degree
Bachelor's Degree Comparison
Costa Ricans
Tsimshian
37.7%
BACHELOR'S DEGREE
47.6/ 100
METRIC RATING
176th/ 347
METRIC RANK
28.8%
BACHELOR'S DEGREE
0.0/ 100
METRIC RATING
322nd/ 347
METRIC RANK
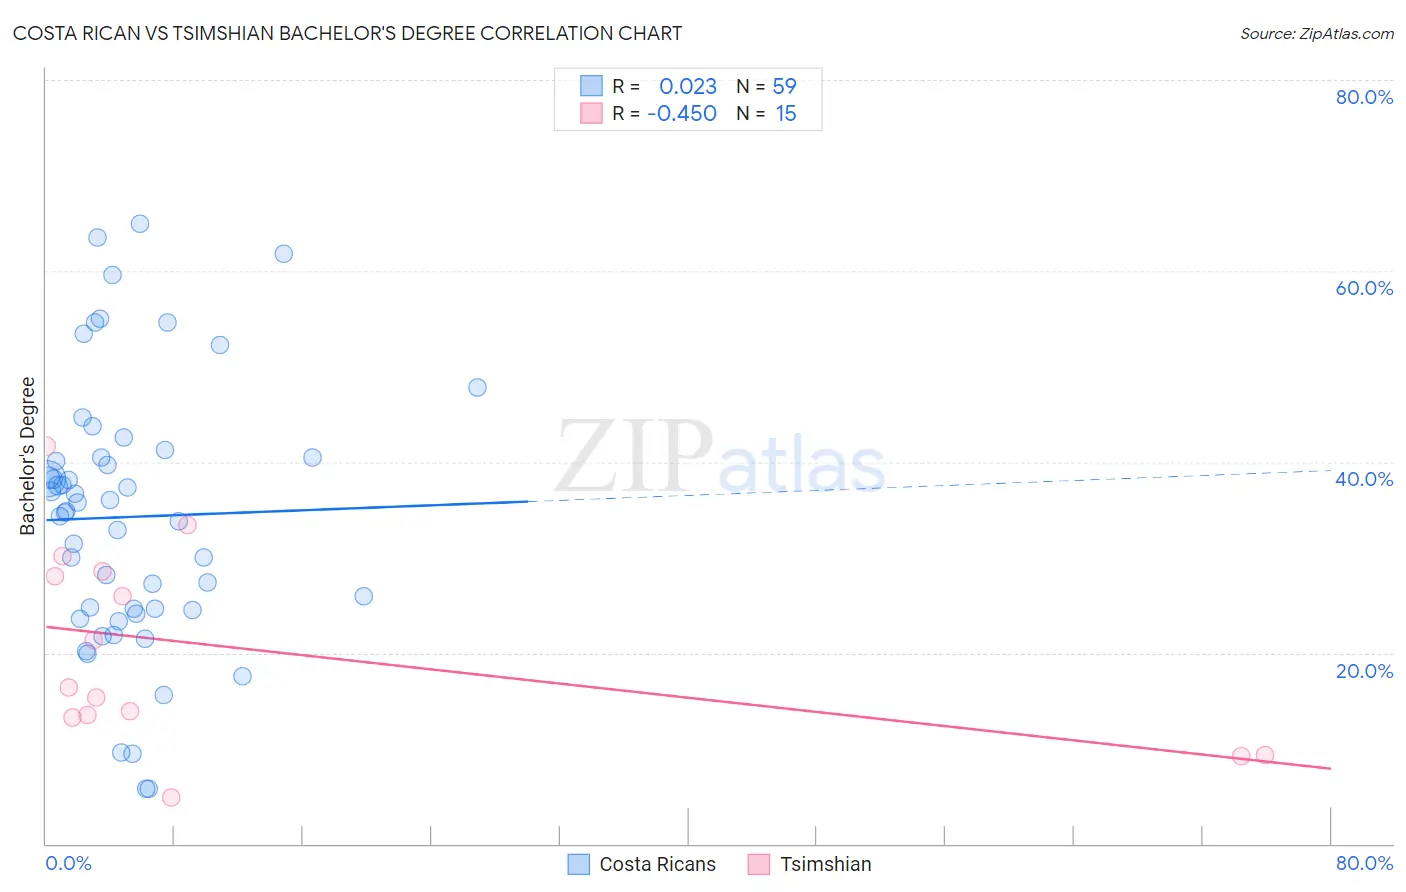
Costa Rican vs Tsimshian Bachelor's Degree Correlation Chart
The statistical analysis conducted on geographies consisting of 253,595,641 people shows no correlation between the proportion of Costa Ricans and percentage of population with at least bachelor's degree education in the United States with a correlation coefficient (R) of 0.023 and weighted average of 37.7%. Similarly, the statistical analysis conducted on geographies consisting of 15,626,544 people shows a moderate negative correlation between the proportion of Tsimshian and percentage of population with at least bachelor's degree education in the United States with a correlation coefficient (R) of -0.450 and weighted average of 28.8%, a difference of 31.2%.
Bachelor's Degree Correlation Summary
| Measurement | Costa Rican | Tsimshian |
| Minimum | 5.7% | 4.9% |
| Maximum | 65.0% | 41.6% |
| Range | 59.3% | 36.7% |
| Mean | 34.2% | 20.3% |
| Median | 34.8% | 16.4% |
| Interquartile 25% (IQ1) | 24.5% | 13.3% |
| Interquartile 75% (IQ3) | 40.5% | 28.5% |
| Interquartile Range (IQR) | 16.0% | 15.3% |
| Standard Deviation (Sample) | 13.9% | 10.5% |
| Standard Deviation (Population) | 13.8% | 10.1% |
Similar Demographics by Bachelor's Degree
Demographics Similar to Costa Ricans by Bachelor's Degree
In terms of bachelor's degree, the demographic groups most similar to Costa Ricans are Basque (37.7%, a difference of 0.020%), Immigrants from Uruguay (37.8%, a difference of 0.080%), Immigrants from Cameroon (37.7%, a difference of 0.080%), Immigrants from Colombia (37.7%, a difference of 0.21%), and Immigrants from Bangladesh (37.8%, a difference of 0.24%).
| Demographics | Rating | Rank | Bachelor's Degree |
| Ghanaians | 55.3 /100 | #169 | Average 38.0% |
| Czechs | 54.4 /100 | #170 | Average 38.0% |
| Bermudans | 54.2 /100 | #171 | Average 38.0% |
| Immigrants | Somalia | 52.8 /100 | #172 | Average 37.9% |
| Immigrants | Iraq | 52.5 /100 | #173 | Average 37.9% |
| Immigrants | Bangladesh | 50.0 /100 | #174 | Average 37.8% |
| Immigrants | Uruguay | 48.3 /100 | #175 | Average 37.8% |
| Costa Ricans | 47.6 /100 | #176 | Average 37.7% |
| Basques | 47.4 /100 | #177 | Average 37.7% |
| Immigrants | Cameroon | 46.8 /100 | #178 | Average 37.7% |
| Immigrants | Colombia | 45.4 /100 | #179 | Average 37.7% |
| Irish | 44.3 /100 | #180 | Average 37.6% |
| Immigrants | Senegal | 43.8 /100 | #181 | Average 37.6% |
| Immigrants | Bosnia and Herzegovina | 43.4 /100 | #182 | Average 37.6% |
| Senegalese | 42.2 /100 | #183 | Average 37.5% |
Demographics Similar to Tsimshian by Bachelor's Degree
In terms of bachelor's degree, the demographic groups most similar to Tsimshian are Fijian (28.7%, a difference of 0.14%), Alaskan Athabascan (28.8%, a difference of 0.22%), Kiowa (28.8%, a difference of 0.30%), Creek (28.9%, a difference of 0.35%), and Yaqui (29.0%, a difference of 0.80%).
| Demographics | Rating | Rank | Bachelor's Degree |
| Immigrants | Cabo Verde | 0.0 /100 | #315 | Tragic 29.2% |
| Sioux | 0.0 /100 | #316 | Tragic 29.1% |
| Colville | 0.0 /100 | #317 | Tragic 29.0% |
| Yaqui | 0.0 /100 | #318 | Tragic 29.0% |
| Creek | 0.0 /100 | #319 | Tragic 28.9% |
| Kiowa | 0.0 /100 | #320 | Tragic 28.8% |
| Alaskan Athabascans | 0.0 /100 | #321 | Tragic 28.8% |
| Tsimshian | 0.0 /100 | #322 | Tragic 28.8% |
| Fijians | 0.0 /100 | #323 | Tragic 28.7% |
| Dutch West Indians | 0.0 /100 | #324 | Tragic 28.5% |
| Pennsylvania Germans | 0.0 /100 | #325 | Tragic 28.4% |
| Apache | 0.0 /100 | #326 | Tragic 28.3% |
| Paiute | 0.0 /100 | #327 | Tragic 28.1% |
| Crow | 0.0 /100 | #328 | Tragic 27.7% |
| Immigrants | Central America | 0.0 /100 | #329 | Tragic 27.5% |