Scotch-Irish vs Taiwanese Female Unemployment
COMPARE
Scotch-Irish
Taiwanese
Female Unemployment
Female Unemployment Comparison
Scotch-Irish
Taiwanese
4.8%
FEMALE UNEMPLOYMENT
99.6/ 100
METRIC RATING
39th/ 347
METRIC RANK
5.3%
FEMALE UNEMPLOYMENT
42.7/ 100
METRIC RATING
181st/ 347
METRIC RANK
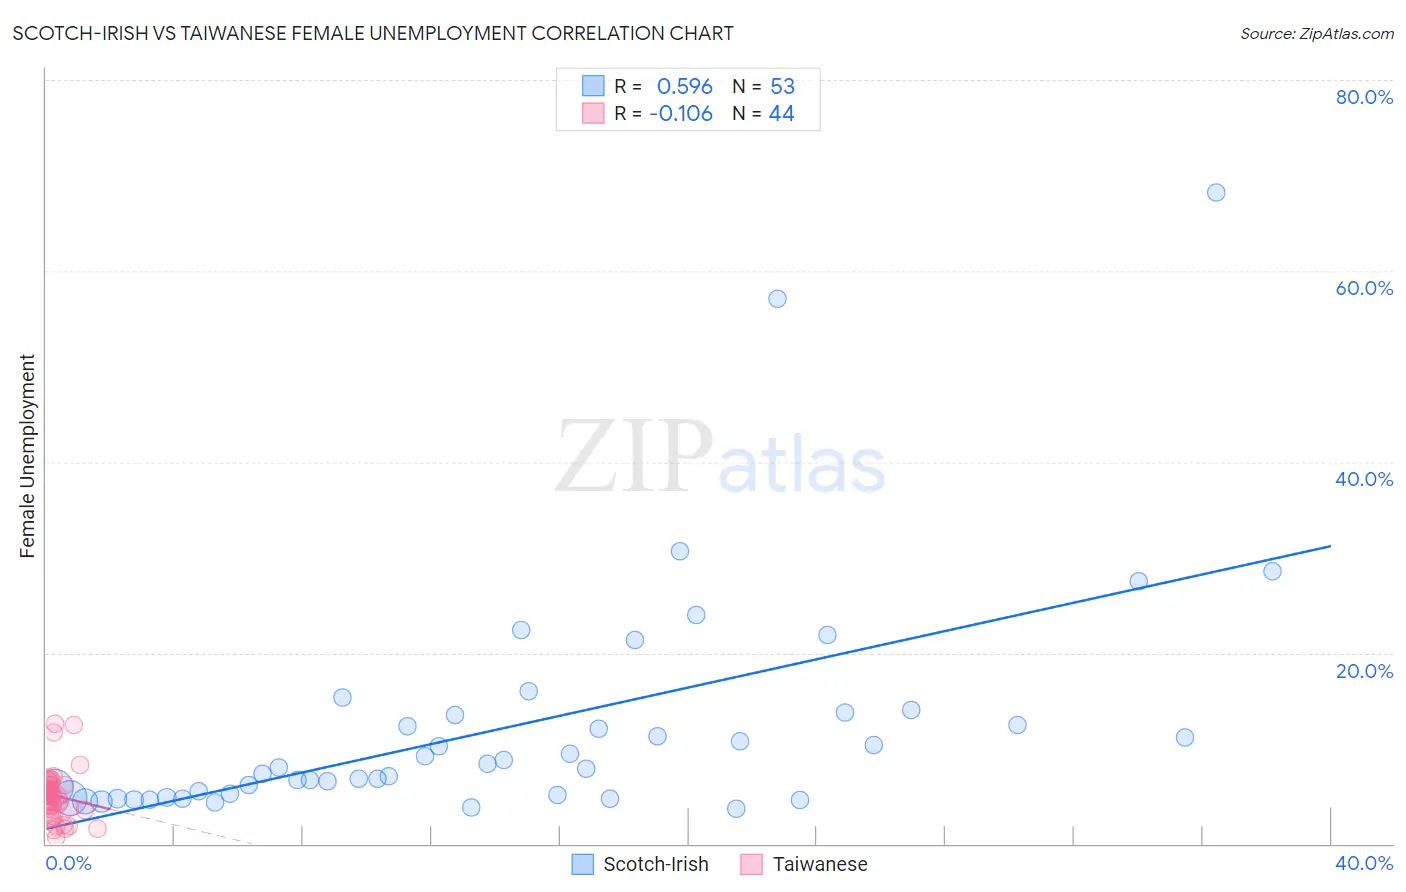
Scotch-Irish vs Taiwanese Female Unemployment Correlation Chart
The statistical analysis conducted on geographies consisting of 537,046,188 people shows a substantial positive correlation between the proportion of Scotch-Irish and unemploymnet rate among females in the United States with a correlation coefficient (R) of 0.596 and weighted average of 4.8%. Similarly, the statistical analysis conducted on geographies consisting of 31,724,268 people shows a poor negative correlation between the proportion of Taiwanese and unemploymnet rate among females in the United States with a correlation coefficient (R) of -0.106 and weighted average of 5.3%, a difference of 9.5%.
Female Unemployment Correlation Summary
| Measurement | Scotch-Irish | Taiwanese |
| Minimum | 3.7% | 0.60% |
| Maximum | 68.2% | 12.6% |
| Range | 64.5% | 12.0% |
| Mean | 12.3% | 5.0% |
| Median | 8.0% | 5.0% |
| Interquartile 25% (IQ1) | 5.0% | 3.4% |
| Interquartile 75% (IQ3) | 13.6% | 6.2% |
| Interquartile Range (IQR) | 8.7% | 2.8% |
| Standard Deviation (Sample) | 12.2% | 2.7% |
| Standard Deviation (Population) | 12.1% | 2.6% |
Similar Demographics by Female Unemployment
Demographics Similar to Scotch-Irish by Female Unemployment
In terms of female unemployment, the demographic groups most similar to Scotch-Irish are Northern European (4.8%, a difference of 0.010%), French (4.8%, a difference of 0.040%), Pennsylvania German (4.8%, a difference of 0.12%), Tongan (4.8%, a difference of 0.30%), and Italian (4.8%, a difference of 0.43%).
| Demographics | Rating | Rank | Female Unemployment |
| Slovaks | 99.8 /100 | #32 | Exceptional 4.8% |
| Czechoslovakians | 99.7 /100 | #33 | Exceptional 4.8% |
| Zimbabweans | 99.7 /100 | #34 | Exceptional 4.8% |
| French Canadians | 99.7 /100 | #35 | Exceptional 4.8% |
| Yugoslavians | 99.7 /100 | #36 | Exceptional 4.8% |
| Pennsylvania Germans | 99.6 /100 | #37 | Exceptional 4.8% |
| Northern Europeans | 99.6 /100 | #38 | Exceptional 4.8% |
| Scotch-Irish | 99.6 /100 | #39 | Exceptional 4.8% |
| French | 99.6 /100 | #40 | Exceptional 4.8% |
| Tongans | 99.5 /100 | #41 | Exceptional 4.8% |
| Italians | 99.5 /100 | #42 | Exceptional 4.8% |
| Eastern Europeans | 99.4 /100 | #43 | Exceptional 4.9% |
| Greeks | 99.4 /100 | #44 | Exceptional 4.9% |
| Austrians | 99.3 /100 | #45 | Exceptional 4.9% |
| Immigrants | Bulgaria | 99.3 /100 | #46 | Exceptional 4.9% |
Demographics Similar to Taiwanese by Female Unemployment
In terms of female unemployment, the demographic groups most similar to Taiwanese are Nonimmigrants (5.3%, a difference of 0.010%), Immigrants from Congo (5.3%, a difference of 0.020%), Immigrants from Indonesia (5.3%, a difference of 0.12%), Laotian (5.3%, a difference of 0.14%), and Immigrants from Ukraine (5.3%, a difference of 0.16%).
| Demographics | Rating | Rank | Female Unemployment |
| Immigrants | Poland | 50.0 /100 | #174 | Average 5.3% |
| Immigrants | Laos | 47.5 /100 | #175 | Average 5.3% |
| Immigrants | Vietnam | 47.5 /100 | #176 | Average 5.3% |
| Immigrants | Morocco | 47.4 /100 | #177 | Average 5.3% |
| Immigrants | Southern Europe | 46.2 /100 | #178 | Average 5.3% |
| Laotians | 45.1 /100 | #179 | Average 5.3% |
| Immigrants | Congo | 43.1 /100 | #180 | Average 5.3% |
| Taiwanese | 42.7 /100 | #181 | Average 5.3% |
| Immigrants | Nonimmigrants | 42.6 /100 | #182 | Average 5.3% |
| Immigrants | Indonesia | 40.7 /100 | #183 | Average 5.3% |
| Immigrants | Ukraine | 40.1 /100 | #184 | Average 5.3% |
| Malaysians | 40.1 /100 | #185 | Average 5.3% |
| Immigrants | Belarus | 39.4 /100 | #186 | Fair 5.3% |
| Immigrants | Albania | 35.4 /100 | #187 | Fair 5.3% |
| Afghans | 33.9 /100 | #188 | Fair 5.3% |