Scotch-Irish vs Taiwanese 1 or more Vehicles in Household
COMPARE
Scotch-Irish
Taiwanese
1 or more Vehicles in Household
1 or more Vehicles in Household Comparison
Scotch-Irish
Taiwanese
93.3%
1 OR MORE VEHICLES IN HOUSEHOLD
100.0/ 100
METRIC RATING
9th/ 347
METRIC RANK
88.4%
1 OR MORE VEHICLES IN HOUSEHOLD
2.6/ 100
METRIC RATING
241st/ 347
METRIC RANK
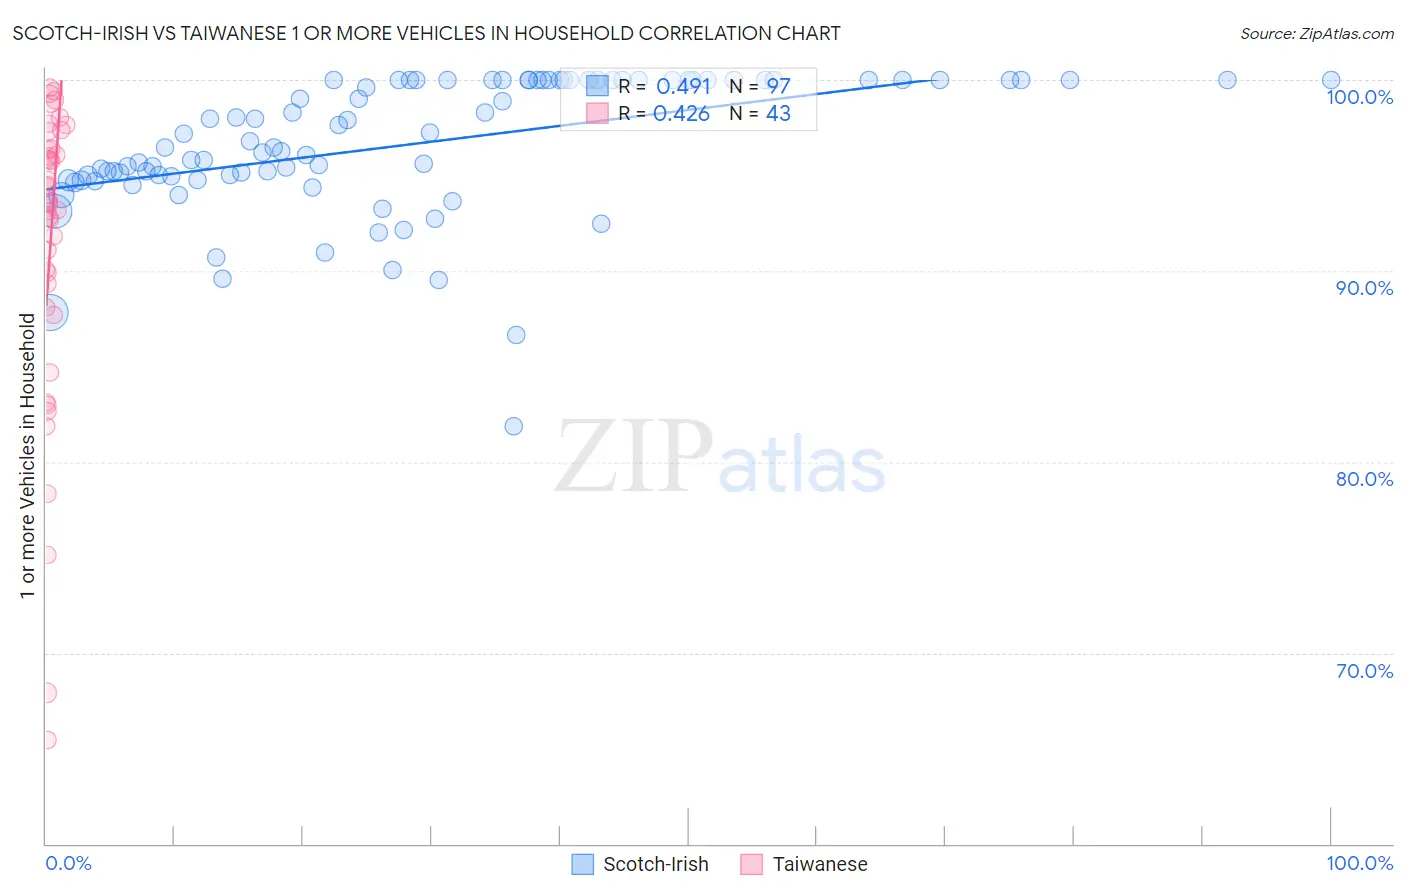
Scotch-Irish vs Taiwanese 1 or more Vehicles in Household Correlation Chart
The statistical analysis conducted on geographies consisting of 548,450,125 people shows a moderate positive correlation between the proportion of Scotch-Irish and percentage of households with 1 or more vehicles available in the United States with a correlation coefficient (R) of 0.491 and weighted average of 93.3%. Similarly, the statistical analysis conducted on geographies consisting of 31,682,064 people shows a moderate positive correlation between the proportion of Taiwanese and percentage of households with 1 or more vehicles available in the United States with a correlation coefficient (R) of 0.426 and weighted average of 88.4%, a difference of 5.5%.
1 or more Vehicles in Household Correlation Summary
| Measurement | Scotch-Irish | Taiwanese |
| Minimum | 81.9% | 65.4% |
| Maximum | 100.0% | 99.6% |
| Range | 18.1% | 34.2% |
| Mean | 96.6% | 91.2% |
| Median | 96.8% | 93.6% |
| Interquartile 25% (IQ1) | 94.9% | 88.1% |
| Interquartile 75% (IQ3) | 100.0% | 96.4% |
| Interquartile Range (IQR) | 5.1% | 8.3% |
| Standard Deviation (Sample) | 3.6% | 8.1% |
| Standard Deviation (Population) | 3.6% | 8.0% |
Similar Demographics by 1 or more Vehicles in Household
Demographics Similar to Scotch-Irish by 1 or more Vehicles in Household
In terms of 1 or more vehicles in household, the demographic groups most similar to Scotch-Irish are Swedish (93.3%, a difference of 0.010%), Dutch (93.3%, a difference of 0.030%), Scottish (93.4%, a difference of 0.060%), Czech (93.3%, a difference of 0.060%), and Scandinavian (93.1%, a difference of 0.21%).
| Demographics | Rating | Rank | 1 or more Vehicles in Household |
| English | 100.0 /100 | #2 | Exceptional 93.8% |
| Norwegians | 100.0 /100 | #3 | Exceptional 93.7% |
| Germans | 100.0 /100 | #4 | Exceptional 93.6% |
| Yakama | 100.0 /100 | #5 | Exceptional 93.6% |
| Danes | 100.0 /100 | #6 | Exceptional 93.5% |
| Scottish | 100.0 /100 | #7 | Exceptional 93.4% |
| Swedes | 100.0 /100 | #8 | Exceptional 93.3% |
| Scotch-Irish | 100.0 /100 | #9 | Exceptional 93.3% |
| Dutch | 100.0 /100 | #10 | Exceptional 93.3% |
| Czechs | 100.0 /100 | #11 | Exceptional 93.3% |
| Scandinavians | 100.0 /100 | #12 | Exceptional 93.1% |
| Whites/Caucasians | 100.0 /100 | #13 | Exceptional 93.1% |
| Irish | 100.0 /100 | #14 | Exceptional 93.1% |
| Mexicans | 100.0 /100 | #15 | Exceptional 93.0% |
| Assyrians/Chaldeans/Syriacs | 100.0 /100 | #16 | Exceptional 93.0% |
Demographics Similar to Taiwanese by 1 or more Vehicles in Household
In terms of 1 or more vehicles in household, the demographic groups most similar to Taiwanese are Turkish (88.4%, a difference of 0.020%), Eastern European (88.5%, a difference of 0.050%), Immigrants from Belgium (88.4%, a difference of 0.090%), Immigrants from Portugal (88.3%, a difference of 0.11%), and Immigrants from Czechoslovakia (88.3%, a difference of 0.12%).
| Demographics | Rating | Rank | 1 or more Vehicles in Household |
| Immigrants | Peru | 4.7 /100 | #234 | Tragic 88.6% |
| Paiute | 4.6 /100 | #235 | Tragic 88.6% |
| Immigrants | Pakistan | 4.5 /100 | #236 | Tragic 88.6% |
| Immigrants | Turkey | 4.4 /100 | #237 | Tragic 88.6% |
| Immigrants | Somalia | 4.2 /100 | #238 | Tragic 88.6% |
| Kiowa | 3.8 /100 | #239 | Tragic 88.6% |
| Eastern Europeans | 3.0 /100 | #240 | Tragic 88.5% |
| Taiwanese | 2.6 /100 | #241 | Tragic 88.4% |
| Turks | 2.5 /100 | #242 | Tragic 88.4% |
| Immigrants | Belgium | 2.1 /100 | #243 | Tragic 88.4% |
| Immigrants | Portugal | 2.0 /100 | #244 | Tragic 88.3% |
| Immigrants | Czechoslovakia | 1.9 /100 | #245 | Tragic 88.3% |
| Menominee | 1.9 /100 | #246 | Tragic 88.3% |
| Immigrants | Honduras | 1.7 /100 | #247 | Tragic 88.3% |
| Immigrants | Nigeria | 1.5 /100 | #248 | Tragic 88.2% |