Icelander vs Taiwanese College, Under 1 year
COMPARE
Icelander
Taiwanese
College, Under 1 year
College, Under 1 year Comparison
Icelanders
Taiwanese
68.3%
COLLEGE, UNDER 1 YEAR
98.1/ 100
METRIC RATING
90th/ 347
METRIC RANK
66.4%
COLLEGE, UNDER 1 YEAR
78.6/ 100
METRIC RATING
148th/ 347
METRIC RANK
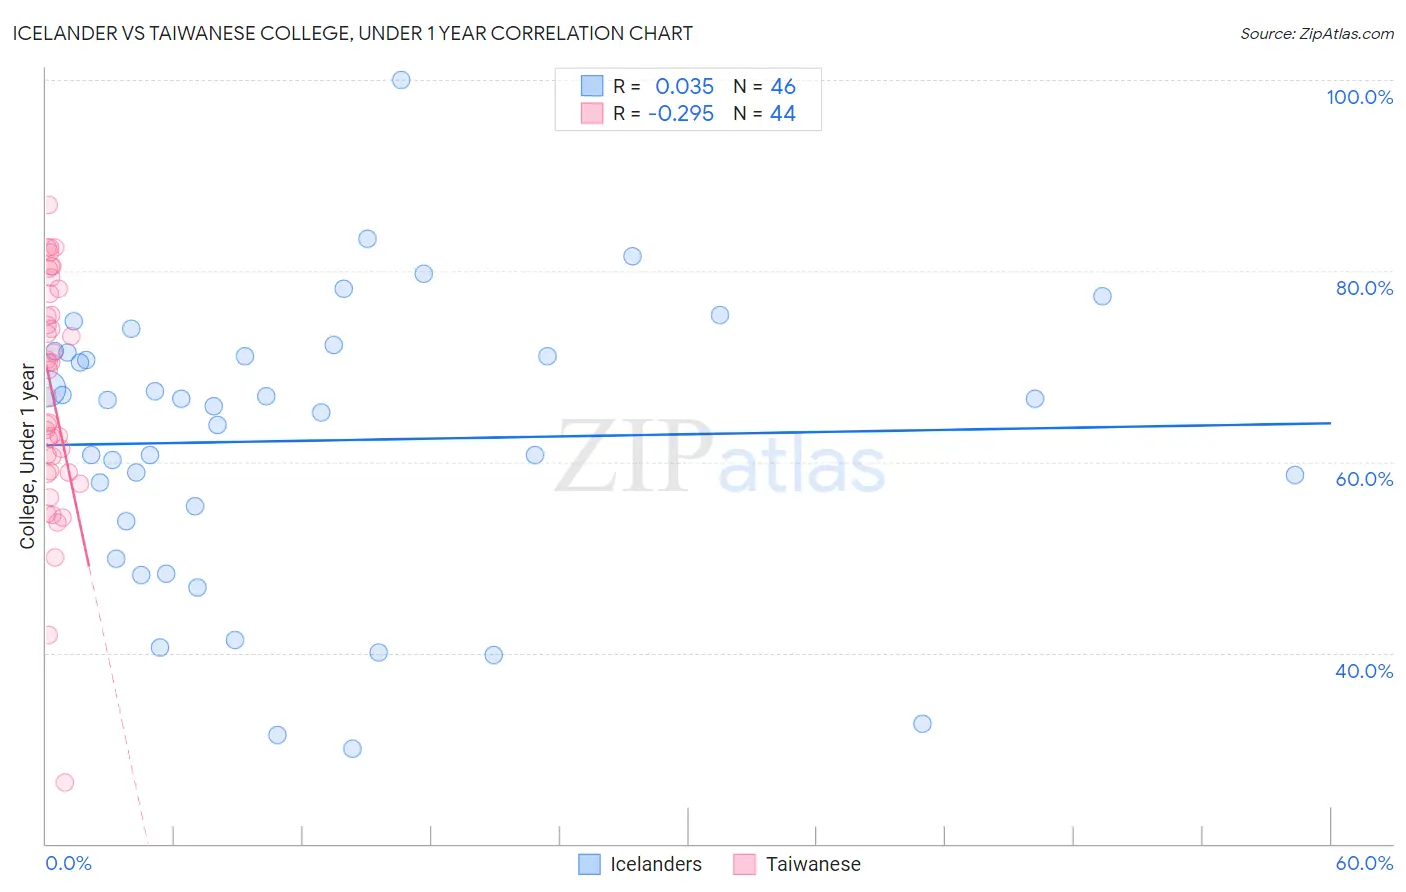
Icelander vs Taiwanese College, Under 1 year Correlation Chart
The statistical analysis conducted on geographies consisting of 159,668,975 people shows no correlation between the proportion of Icelanders and percentage of population with at least college, under 1 year education in the United States with a correlation coefficient (R) of 0.035 and weighted average of 68.3%. Similarly, the statistical analysis conducted on geographies consisting of 31,724,936 people shows a weak negative correlation between the proportion of Taiwanese and percentage of population with at least college, under 1 year education in the United States with a correlation coefficient (R) of -0.295 and weighted average of 66.4%, a difference of 2.9%.
College, Under 1 year Correlation Summary
| Measurement | Icelander | Taiwanese |
| Minimum | 30.0% | 26.4% |
| Maximum | 100.0% | 86.9% |
| Range | 70.0% | 60.6% |
| Mean | 62.2% | 66.9% |
| Median | 66.2% | 68.2% |
| Interquartile 25% (IQ1) | 53.8% | 58.9% |
| Interquartile 75% (IQ3) | 71.5% | 76.5% |
| Interquartile Range (IQR) | 17.7% | 17.6% |
| Standard Deviation (Sample) | 14.9% | 12.3% |
| Standard Deviation (Population) | 14.7% | 12.1% |
Similar Demographics by College, Under 1 year
Demographics Similar to Icelanders by College, Under 1 year
In terms of college, under 1 year, the demographic groups most similar to Icelanders are European (68.2%, a difference of 0.030%), Luxembourger (68.2%, a difference of 0.040%), Ethiopian (68.3%, a difference of 0.060%), Croatian (68.3%, a difference of 0.070%), and Chinese (68.3%, a difference of 0.090%).
| Demographics | Rating | Rank | College, Under 1 year |
| Argentineans | 98.4 /100 | #83 | Exceptional 68.4% |
| Immigrants | Hungary | 98.3 /100 | #84 | Exceptional 68.3% |
| Egyptians | 98.3 /100 | #85 | Exceptional 68.3% |
| Immigrants | Lebanon | 98.3 /100 | #86 | Exceptional 68.3% |
| Chinese | 98.3 /100 | #87 | Exceptional 68.3% |
| Croatians | 98.2 /100 | #88 | Exceptional 68.3% |
| Ethiopians | 98.2 /100 | #89 | Exceptional 68.3% |
| Icelanders | 98.1 /100 | #90 | Exceptional 68.3% |
| Europeans | 98.1 /100 | #91 | Exceptional 68.2% |
| Luxembourgers | 98.1 /100 | #92 | Exceptional 68.2% |
| Romanians | 97.9 /100 | #93 | Exceptional 68.2% |
| Armenians | 97.7 /100 | #94 | Exceptional 68.1% |
| Immigrants | Pakistan | 97.5 /100 | #95 | Exceptional 68.0% |
| Jordanians | 97.4 /100 | #96 | Exceptional 68.0% |
| Immigrants | Ethiopia | 97.3 /100 | #97 | Exceptional 68.0% |
Demographics Similar to Taiwanese by College, Under 1 year
In terms of college, under 1 year, the demographic groups most similar to Taiwanese are Immigrants from Venezuela (66.3%, a difference of 0.040%), Immigrants from Iraq (66.3%, a difference of 0.090%), Immigrants from Sudan (66.2%, a difference of 0.16%), Kenyan (66.5%, a difference of 0.21%), and Immigrants from Morocco (66.5%, a difference of 0.21%).
| Demographics | Rating | Rank | College, Under 1 year |
| Immigrants | Afghanistan | 85.1 /100 | #141 | Excellent 66.7% |
| English | 82.9 /100 | #142 | Excellent 66.6% |
| Immigrants | Uganda | 82.8 /100 | #143 | Excellent 66.5% |
| Immigrants | Germany | 82.0 /100 | #144 | Excellent 66.5% |
| Immigrants | Kenya | 81.8 /100 | #145 | Excellent 66.5% |
| Kenyans | 81.7 /100 | #146 | Excellent 66.5% |
| Immigrants | Morocco | 81.7 /100 | #147 | Excellent 66.5% |
| Taiwanese | 78.6 /100 | #148 | Good 66.4% |
| Immigrants | Venezuela | 77.9 /100 | #149 | Good 66.3% |
| Immigrants | Iraq | 77.1 /100 | #150 | Good 66.3% |
| Immigrants | Sudan | 76.0 /100 | #151 | Good 66.2% |
| Sudanese | 74.1 /100 | #152 | Good 66.2% |
| Belgians | 73.7 /100 | #153 | Good 66.2% |
| Immigrants | Eritrea | 71.9 /100 | #154 | Good 66.1% |
| Irish | 70.3 /100 | #155 | Good 66.0% |